Report for Alexander Borisov |
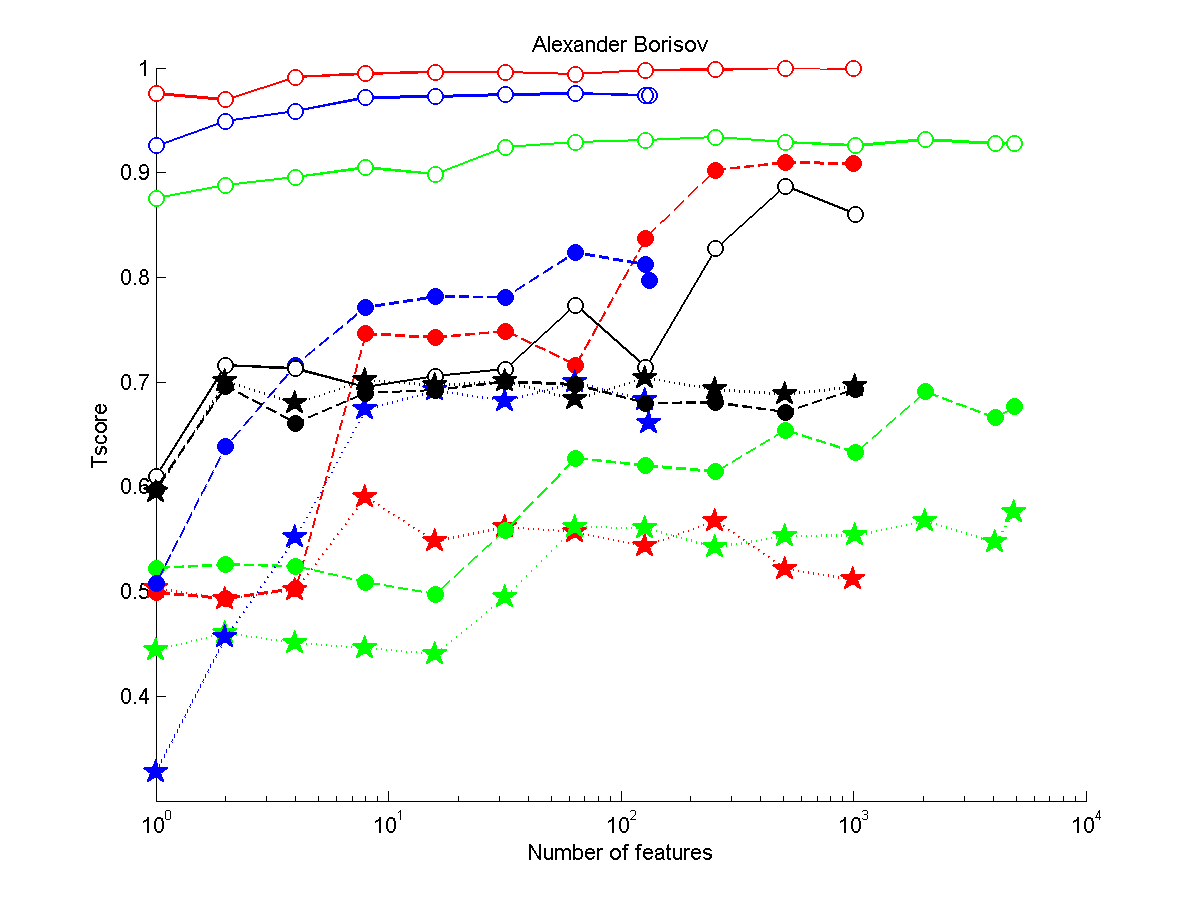
Figure 1: Performance as a function of the number of features. (Click to enlarge). Legend: red: REGED, green: SIDO, blue: CINA, black: MARTI. circle: version 1 (unmanipulated test set), full circle: version 2 (manipulated), star: version 3 (manipulated)
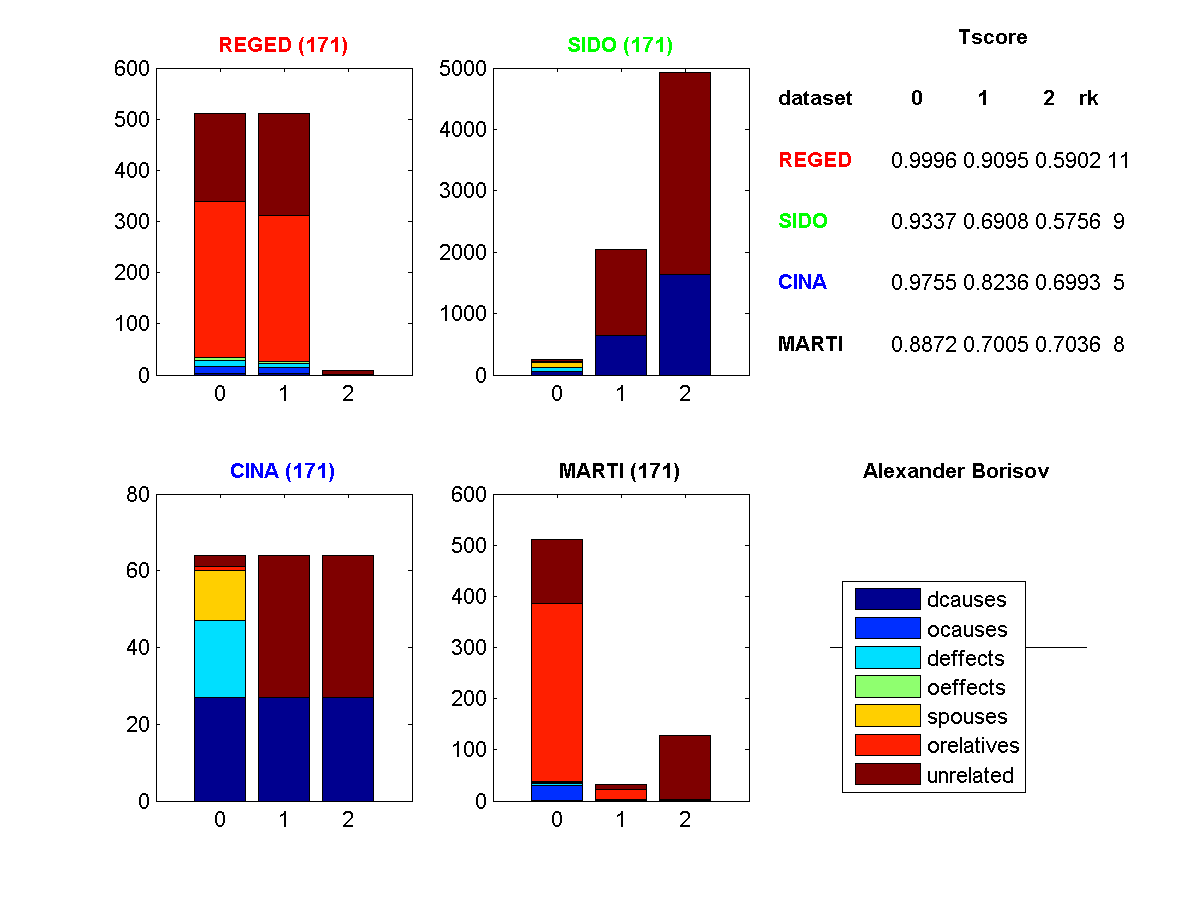
Figure 2: Profile of features selected. (Click to enlarge). Legend: dcause=direct cause, deffect=direct effects, ocauses=other causes (indirect), oeffects=other effects (indirect), spouses=parent of a direct effect, orelatives=other relatives, unrelated=completely irrelevant
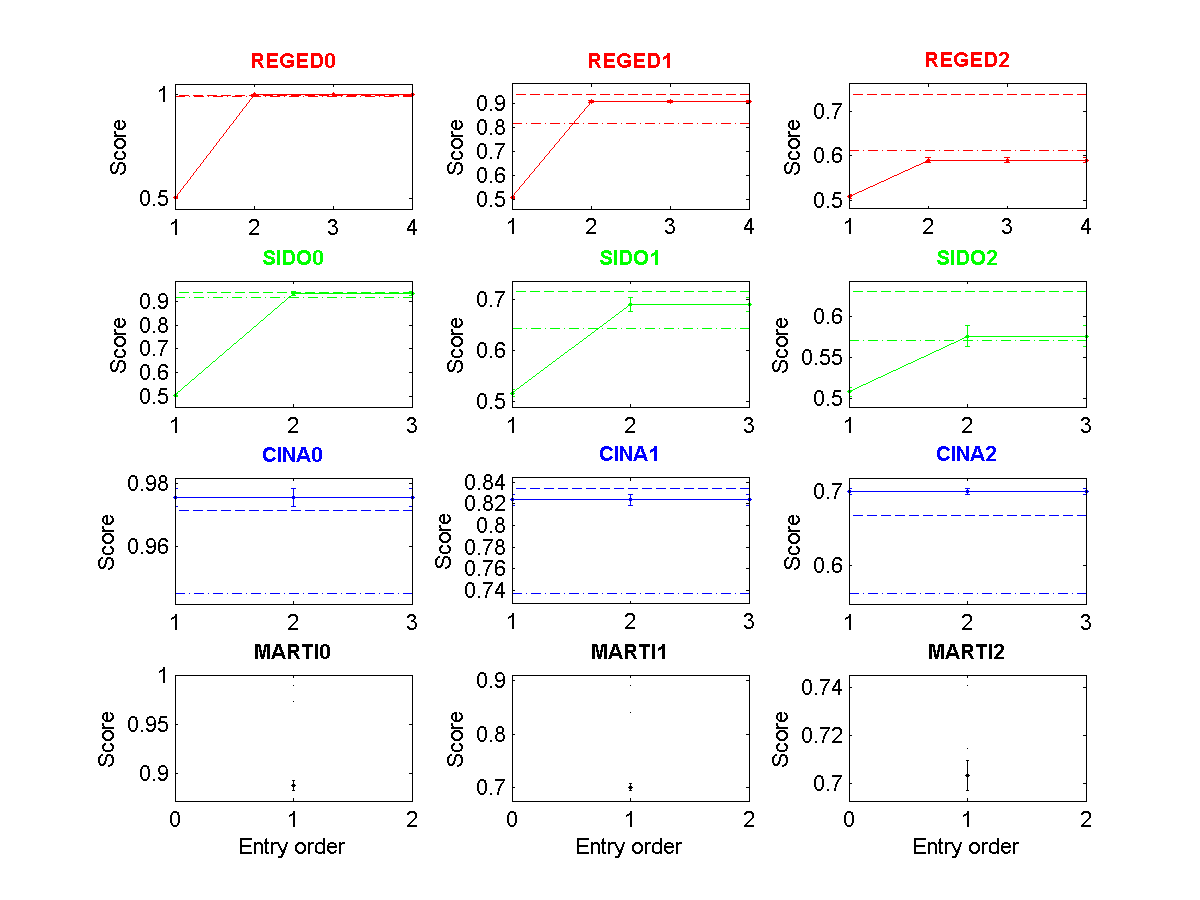
Figure 3: Tscore of all entries made as a function of entry order. (Click to enlarge). The dashed lines indicate the 25 and 50 percentiles.
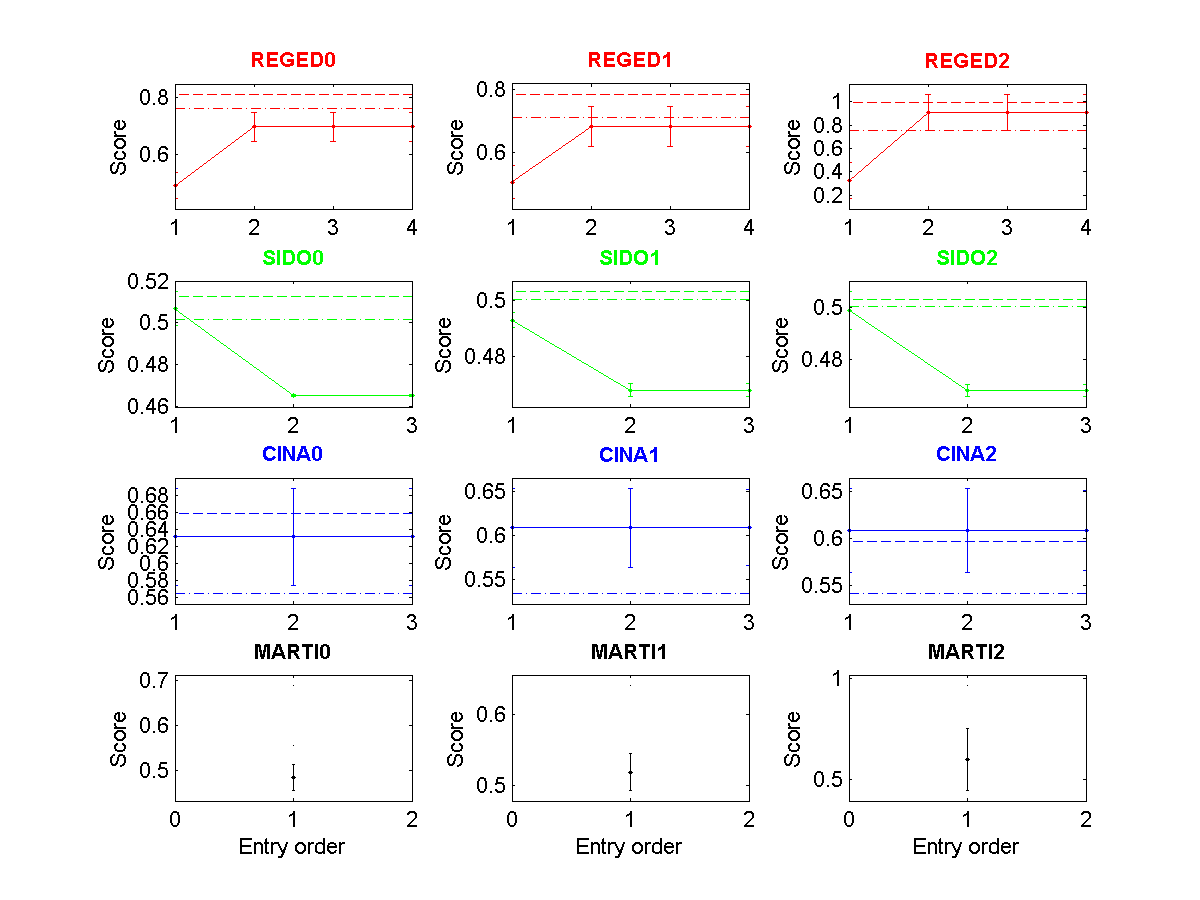
Figure 4: Fscore of all entries made as a function of entry order. (Click to enlarge). The dashed lines indicate the 25 and 50 percentiles.
| * | Entry | Method | Fnum | Fscore | Tscore (Ts) | Top Ts | Max Ts | <Tscore> | Rank |
| REGED0 | 171 | ACE+GBT | 512/999 ** | 0.6969 | 0.9996Ý0.0009 | 1.0000 | 1.0000 | ||
| REGED1 | 171 | ACE+GBT | 512/999 ** | 0.6838 | 0.9095Ý0.0038 | 0.9980 | 0.9980 | 0.8331 | 11 |
| REGED2 | 171 | ACE+GBT | 8/999 ** | 0.9107 | 0.5902Ý0.0059 | 0.8600 | 0.9534 | ||
| SIDO0 | 171 | ACE+GBT | 256/4932 ** | 0.4653 | 0.9337Ý0.0076 | 0.9443 | 0.9467 | ||
| SIDO1 | 171 | ACE+GBT | 2048/4932 ** | 0.4680 | 0.6908Ý0.0136 | 0.7532 | 0.7893 | 0.7333 | 9 |
| SIDO2 | 171 | ACE+GBT | 4932/4932 ** | 0.4680 | 0.5756Ý0.0130 | 0.6684 | 0.7674 | ||
| CINA0 | 171 | ACE+GBT | 64/132 ** | 0.6312 | 0.9755Ý0.0029 | 0.9788 | 0.9788 | ||
| CINA1 | 171 | ACE+GBT | 64/132 ** | 0.6085 | 0.8236Ý0.0048 | 0.8977 | 0.8977 | 0.8328 | 5 |
| CINA2 | 171 | ACE+GBT | 64/132 ** | 0.6085 | 0.6993Ý0.0043 | 0.8157 | 0.8910 | ||
| MARTI0 | 171 | ACE+GBT | 512/1024 ** | 0.4841 | 0.8872Ý0.0050 | 0.9996 | 0.9996 | ||
| MARTI1 | 171 | ACE+GBT | 32/1024 ** | 0.5188 | 0.7005Ý0.0061 | 0.9470 | 0.9542 | 0.7638 | 8 |
| MARTI2 | 171 | ACE+GBT | 128/1024 ** | 0.5998 | 0.7036Ý0.0063 | 0.7975 | 0.8273 |
