Report for Alexey Polovinkin |
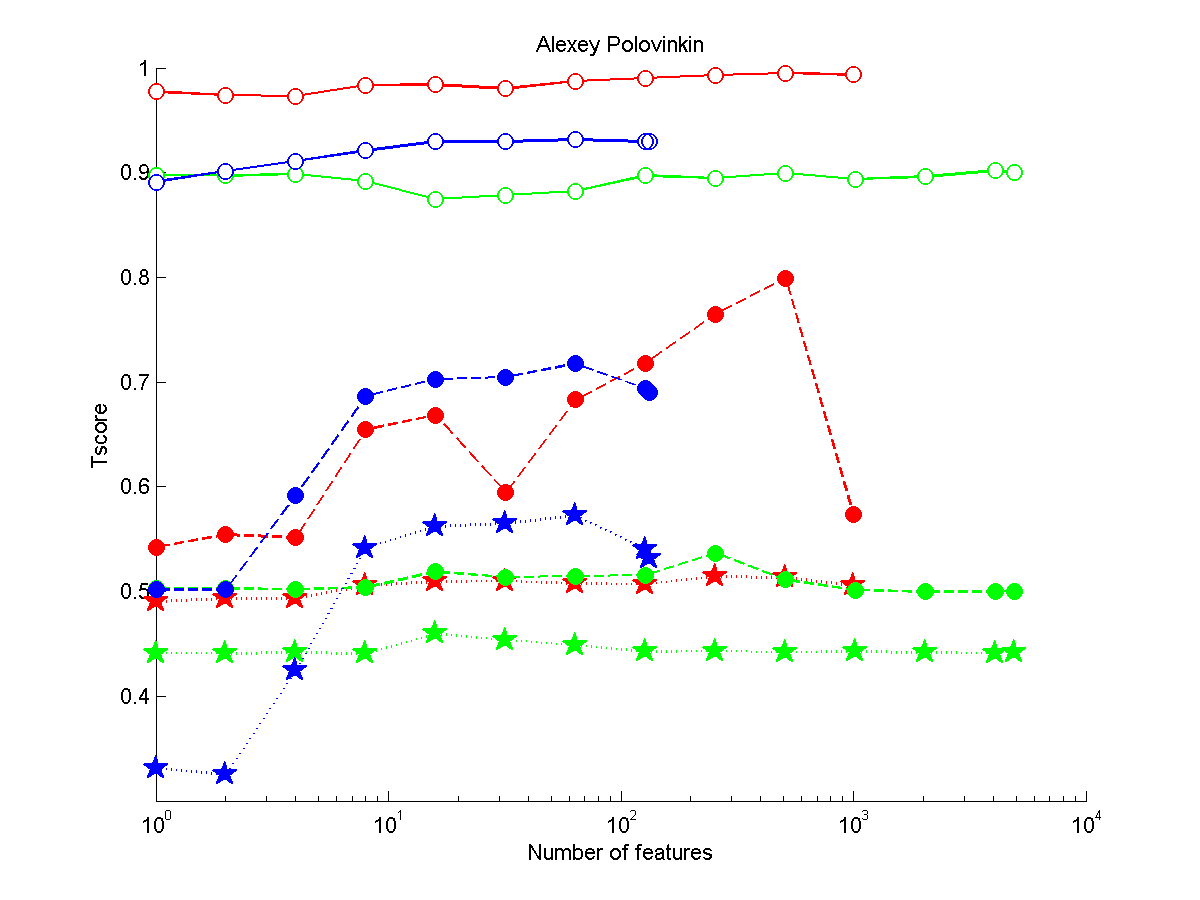
Figure 1: Performance as a function of the number of features. (Click to enlarge). Legend: red: REGED, green: SIDO, blue: CINA, black: MARTI. circle: version 1 (unmanipulated test set), full circle: version 2 (manipulated), star: version 3 (manipulated)
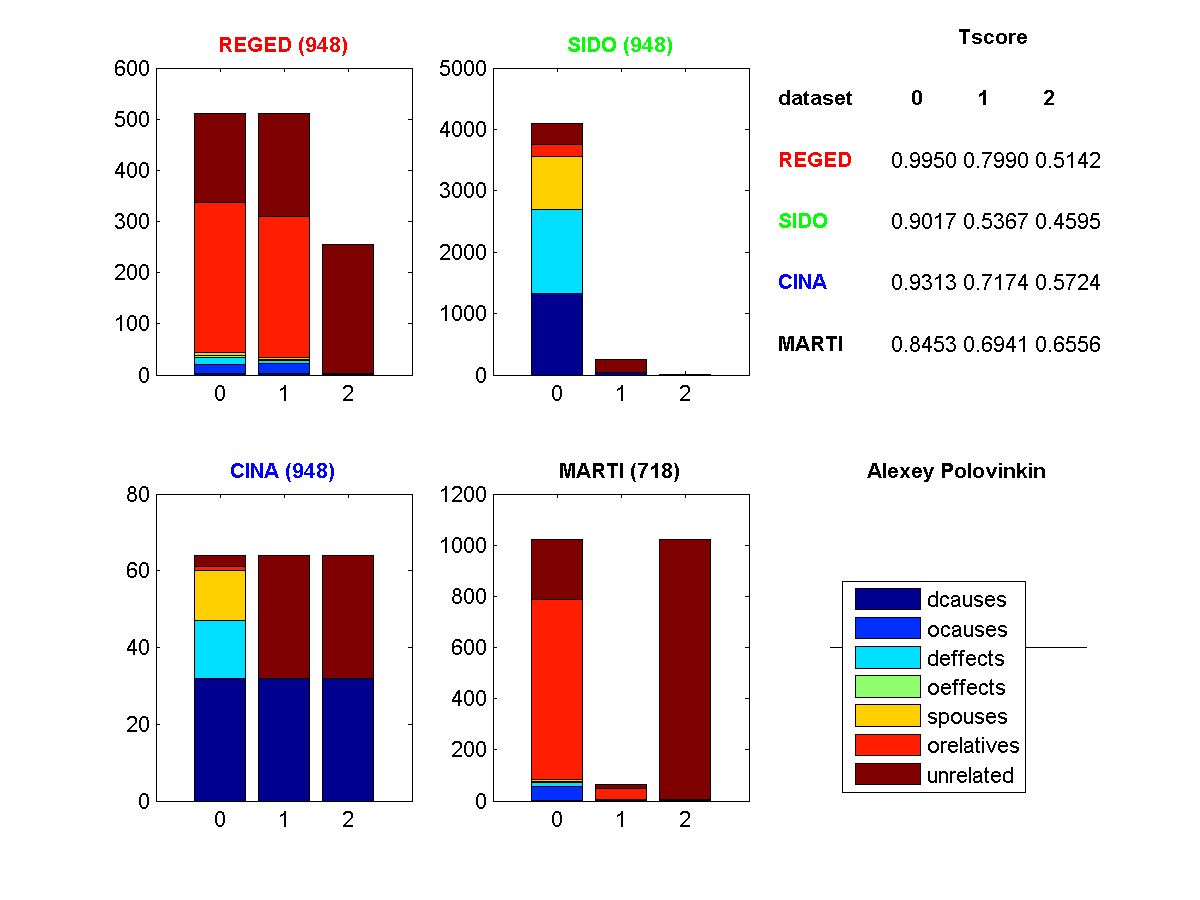
Figure 2: Profile of features selected. (Click to enlarge). Legend: dcause=direct cause, deffect=direct effects, ocauses=other causes (indirect), oeffects=other effects (indirect), spouses=parent of a direct effect, orelatives=other relatives, unrelated=completely irrelevant
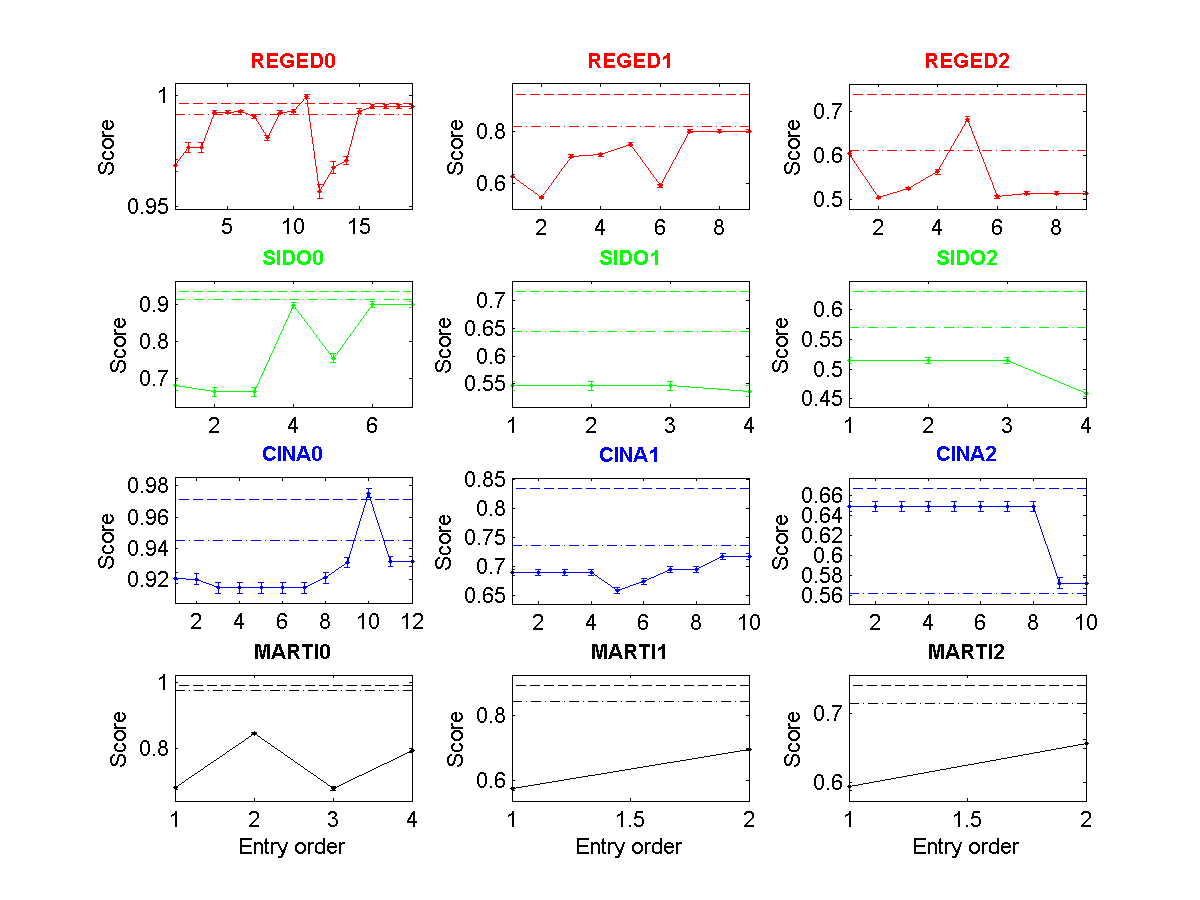
Figure 3: Tscore of all entries made as a function of entry order. (Click to enlarge). The dashed lines indicate the 25 and 50 percentiles.
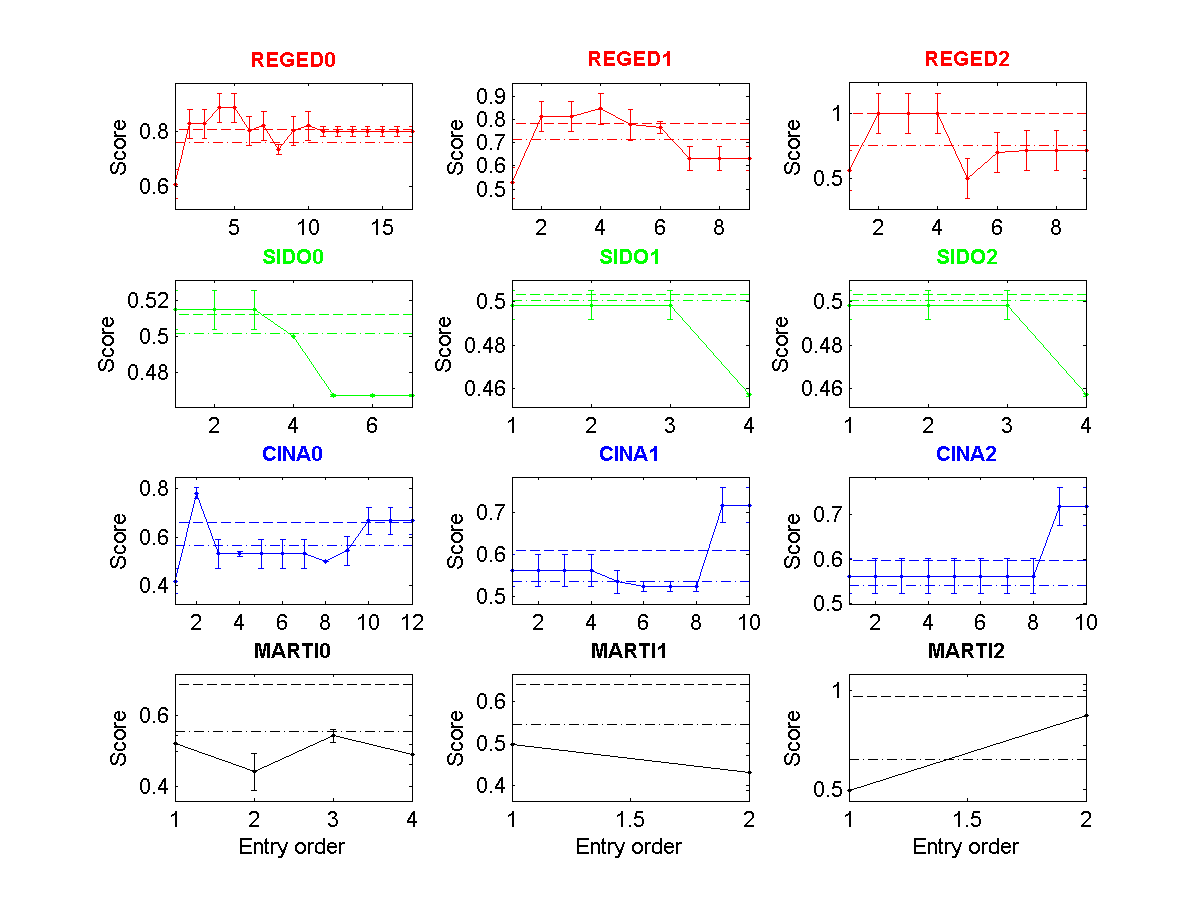
Figure 4: Fscore of all entries made as a function of entry order. (Click to enlarge). The dashed lines indicate the 25 and 50 percentiles.
| * | Entry | Method | Fnum | Fscore | Tscore (Ts) | Top Ts | Max Ts | <Tscore> | Rank |
| REGED0 | 948 | FS | 512/999 ** | 0.8011 | 0.9950Ý0.0009 | 1.0000 | 1.0000 | ||
| REGED1 | 948 | FS | 512/999 ** | 0.6319 | 0.7990Ý0.0057 | 0.9980 | 0.9980 | 0.7694 | |
| REGED2 | 948 | FS | 256/999 ** | 0.7111 | 0.5142Ý0.0033 | 0.8600 | 0.9534 | ||
| SIDO0 | 948 | FS | 4096/4932 ** | 0.4672 | 0.9017Ý0.0079 | 0.9443 | 0.9467 | ||
| SIDO1 | 948 | FS | 256/4932 ** | 0.4573 | 0.5367Ý0.0097 | 0.7532 | 0.7893 | 0.6326 | |
| SIDO2 | 948 | FS | 16/4932 ** | 0.4573 | 0.4595Ý0.0056 | 0.6684 | 0.7674 | ||
| CINA0 | 948 | FS | 64/132 ** | 0.6675 | 0.9313Ý0.0031 | 0.9788 | 0.9788 | ||
| CINA1 | 948 | FS | 64/132 ** | 0.7177 | 0.7174Ý0.0053 | 0.8977 | 0.8977 | 0.7404 | |
| CINA2 | 948 | FS | 64/132 ** | 0.7177 | 0.5724Ý0.0052 | 0.8157 | 0.8910 | ||
| MARTI0 | 718 | MB estimation | 1024/1024 ** | 0.4414 | 0.8453Ý0.0028 | 0.9996 | 0.9996 | ||
| MARTI1 | 718 | MB estimation | 64/1024 ** | 0.4302 | 0.6941Ý0.0033 | 0.9470 | 0.9542 | 0.7317 | |
| MARTI2 | 718 | MB estimation | 1024/1024 ** | 0.8752 | 0.6556Ý0.0063 | 0.7975 | 0.8273 |
