Report for Chen Chu An |
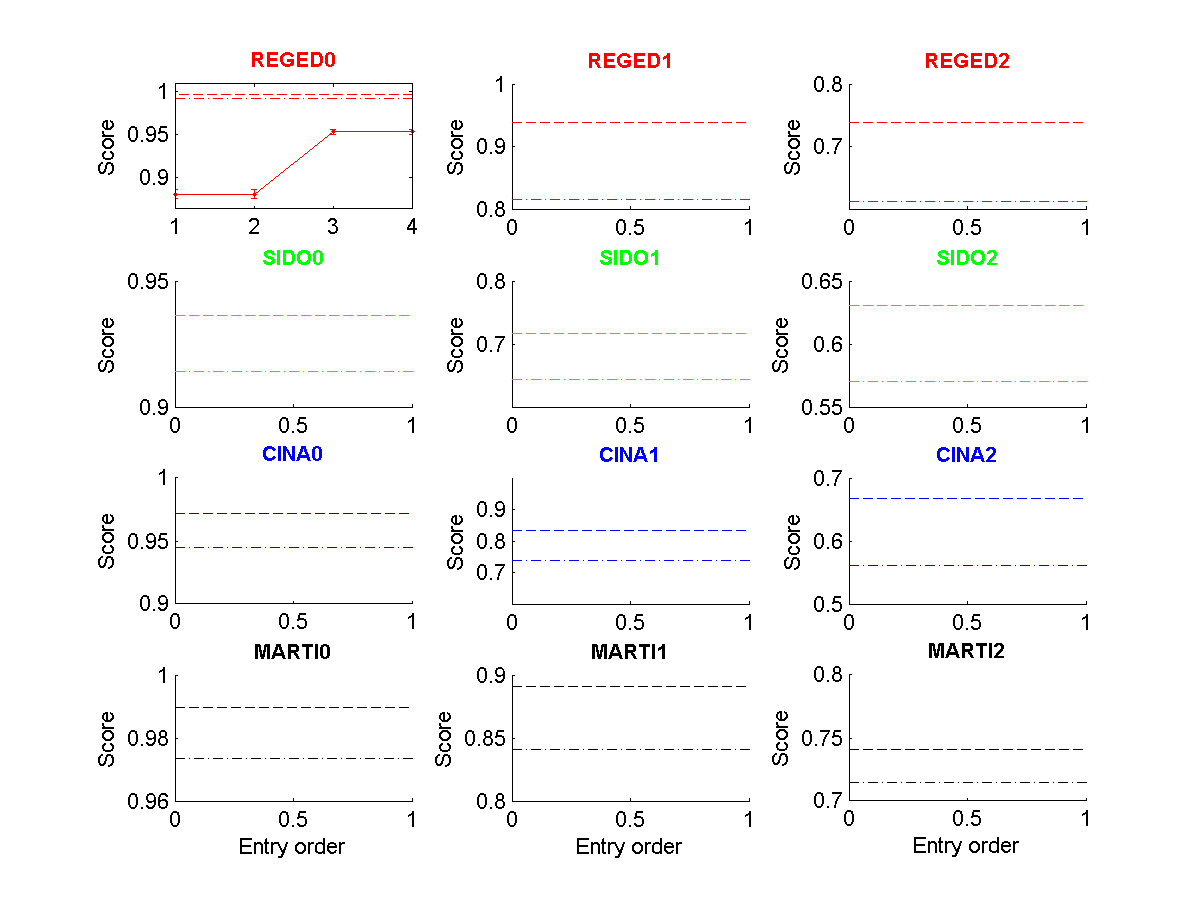
Figure 1: Tscore of all entries made as a function of entry order. (Click to enlarge). The dashed lines indicate the 25 and 50 percentiles.
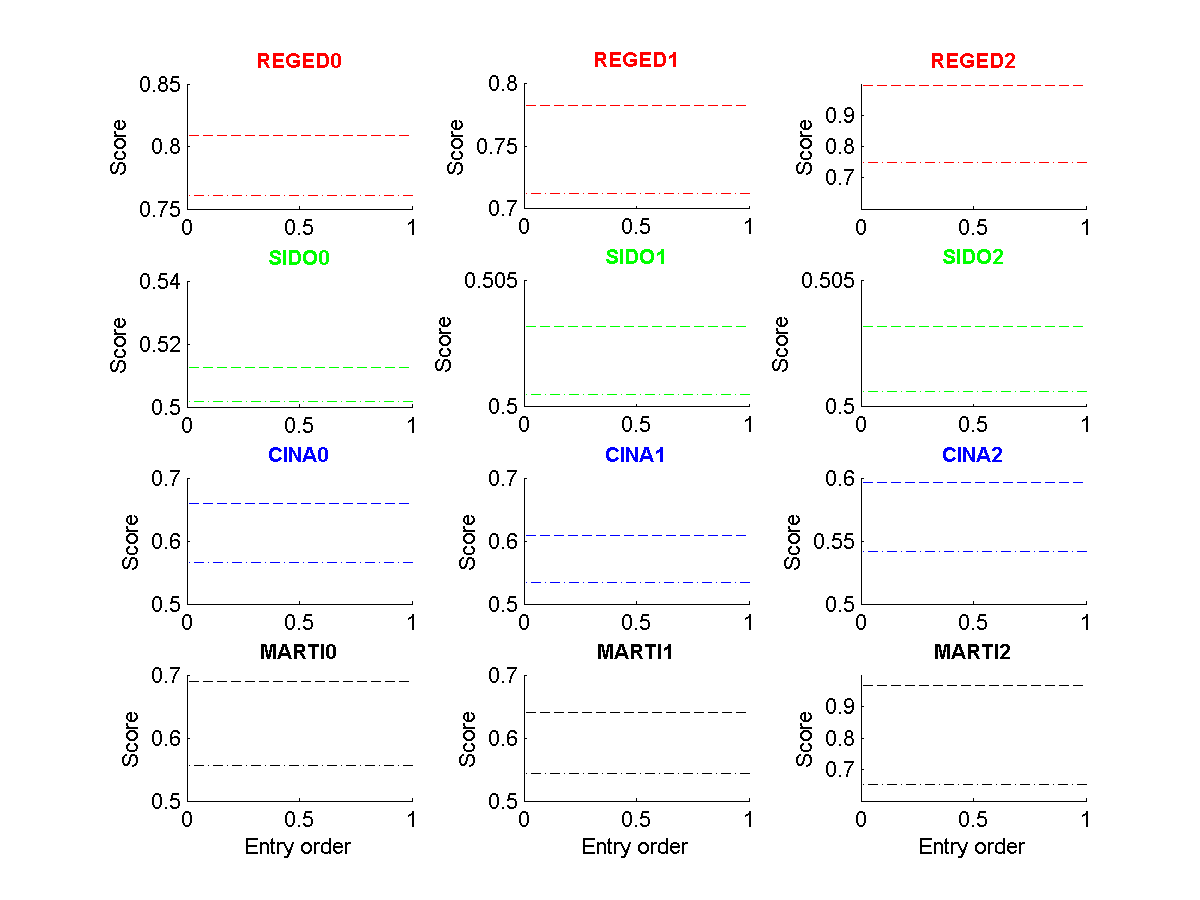
Figure 2: Fscore of all entries made as a function of entry order. (Click to enlarge). The dashed lines indicate the 25 and 50 percentiles.
