Report for Cristian Grozea |
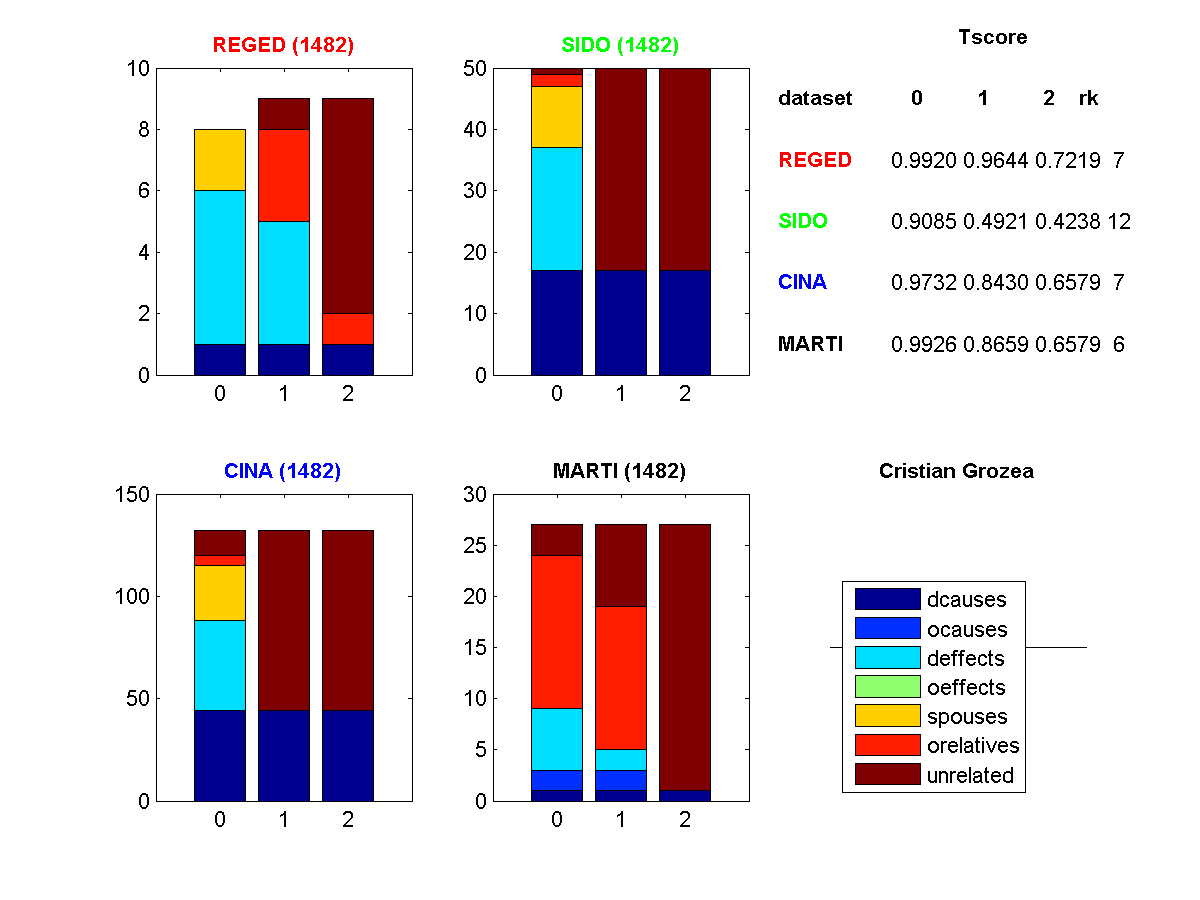
Figure 1: Profile of features selected. (Click to enlarge). Legend: dcause=direct cause, deffect=direct effects, ocauses=other causes (indirect), oeffects=other effects (indirect), spouses=parent of a direct effect, orelatives=other relatives, unrelated=completely irrelevant

Figure 2: Tscore of all entries made as a function of entry order. (Click to enlarge). The dashed lines indicate the 25 and 50 percentiles.

Figure 3: Fscore of all entries made as a function of entry order. (Click to enlarge). The dashed lines indicate the 25 and 50 percentiles.
| * | Entry | Method | Fnum | Fscore | Tscore (Ts) | Top Ts | Max Ts | <Tscore> | Rank |
| REGED0 | 1482 | mixed | 8/999 * | 0.6905 | 0.9920Ý0.0020 | 1.0000 | 1.0000 | ||
| REGED1 | 1482 | mixed | 9/999 * | 0.6765 | 0.9644Ý0.0037 | 0.9980 | 0.9980 | 0.8928 | 7 |
| REGED2 | 1482 | mixed | 9/999 * | 0.7465 | 0.7219Ý0.0059 | 0.8600 | 0.9534 | ||
| SIDO0 | 1482 | mixed | 50/4932 * | 0.5031 | 0.9085Ý0.0090 | 0.9443 | 0.9467 | ||
| SIDO1 | 1482 | mixed | 50/4932 * | 0.5002 | 0.4921Ý0.0123 | 0.7532 | 0.7893 | 0.6081 | 12 |
| SIDO2 | 1482 | mixed | 50/4932 * | 0.5002 | 0.4238Ý0.0021 | 0.6684 | 0.7674 | ||
| CINA0 | 1482 | mixed | 132/132 * | 0.6210 | 0.9732Ý0.0032 | 0.9788 | 0.9788 | ||
| CINA1 | 1482 | mixed | 132/132 * | 0.7438 | 0.8430Ý0.0047 | 0.8977 | 0.8977 | 0.8247 | 7 |
| CINA2 | 1482 | mixed | 132/132 * | 0.7438 | 0.6579Ý0.0046 | 0.8157 | 0.8910 | ||
| MARTI0 | 1482 | mixed | 27/1024 * | 0.5108 | 0.9926Ý0.0024 | 0.9996 | 0.9996 | ||
| MARTI1 | 1482 | mixed | 27/1024 * | 0.5228 | 0.8659Ý0.0051 | 0.9470 | 0.9542 | 0.8388 | 6 |
| MARTI2 | 1482 | mixed | 27/1024 * | 0.4868 | 0.6579Ý0.0063 | 0.7975 | 0.8273 |
