Report for E. Mwebaze & J. Quinn |

Figure 1: Performance as a function of the number of features. (Click to enlarge). Legend: red: REGED, green: SIDO, blue: CINA, black: MARTI. circle: version 1 (unmanipulated test set), full circle: version 2 (manipulated), star: version 3 (manipulated)
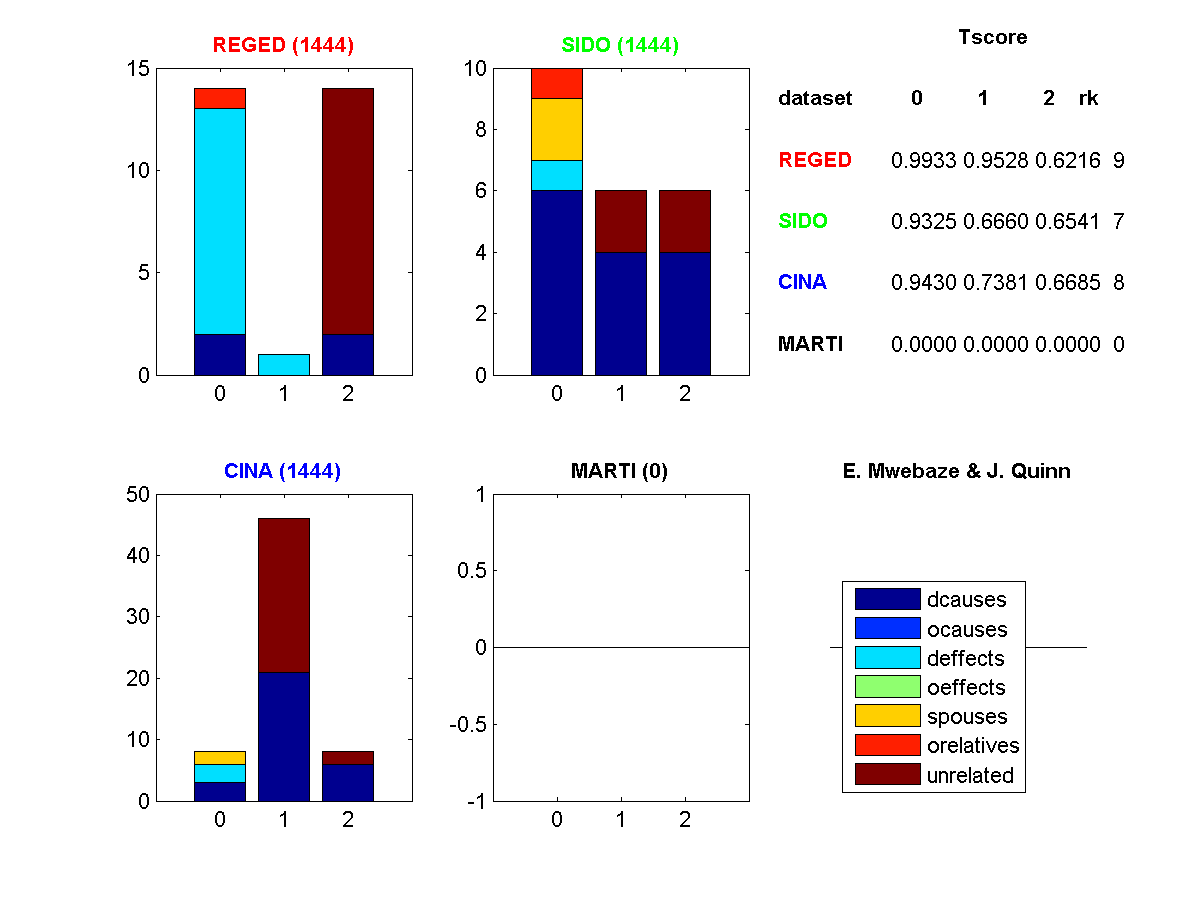
Figure 2: Profile of features selected. (Click to enlarge). Legend: dcause=direct cause, deffect=direct effects, ocauses=other causes (indirect), oeffects=other effects (indirect), spouses=parent of a direct effect, orelatives=other relatives, unrelated=completely irrelevant
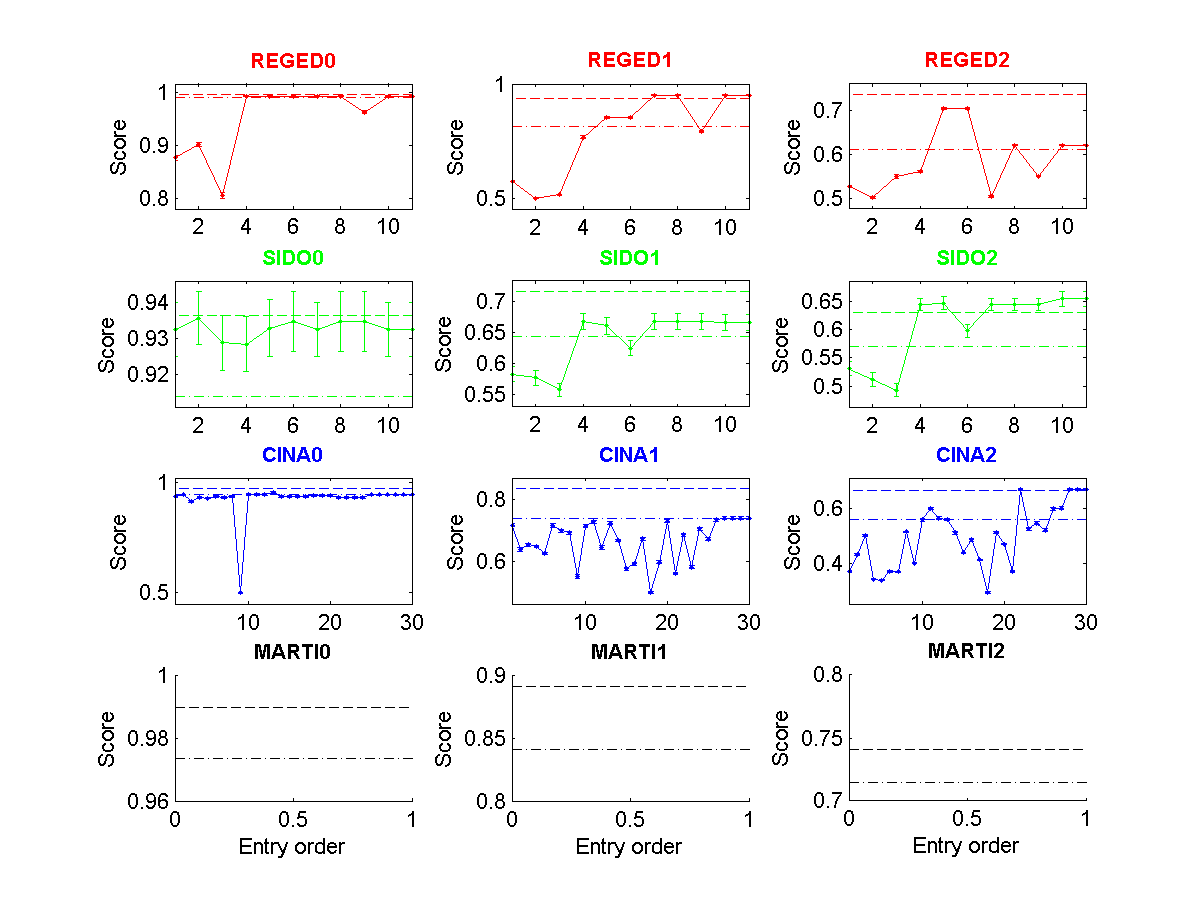
Figure 3: Tscore of all entries made as a function of entry order. (Click to enlarge). The dashed lines indicate the 25 and 50 percentiles.
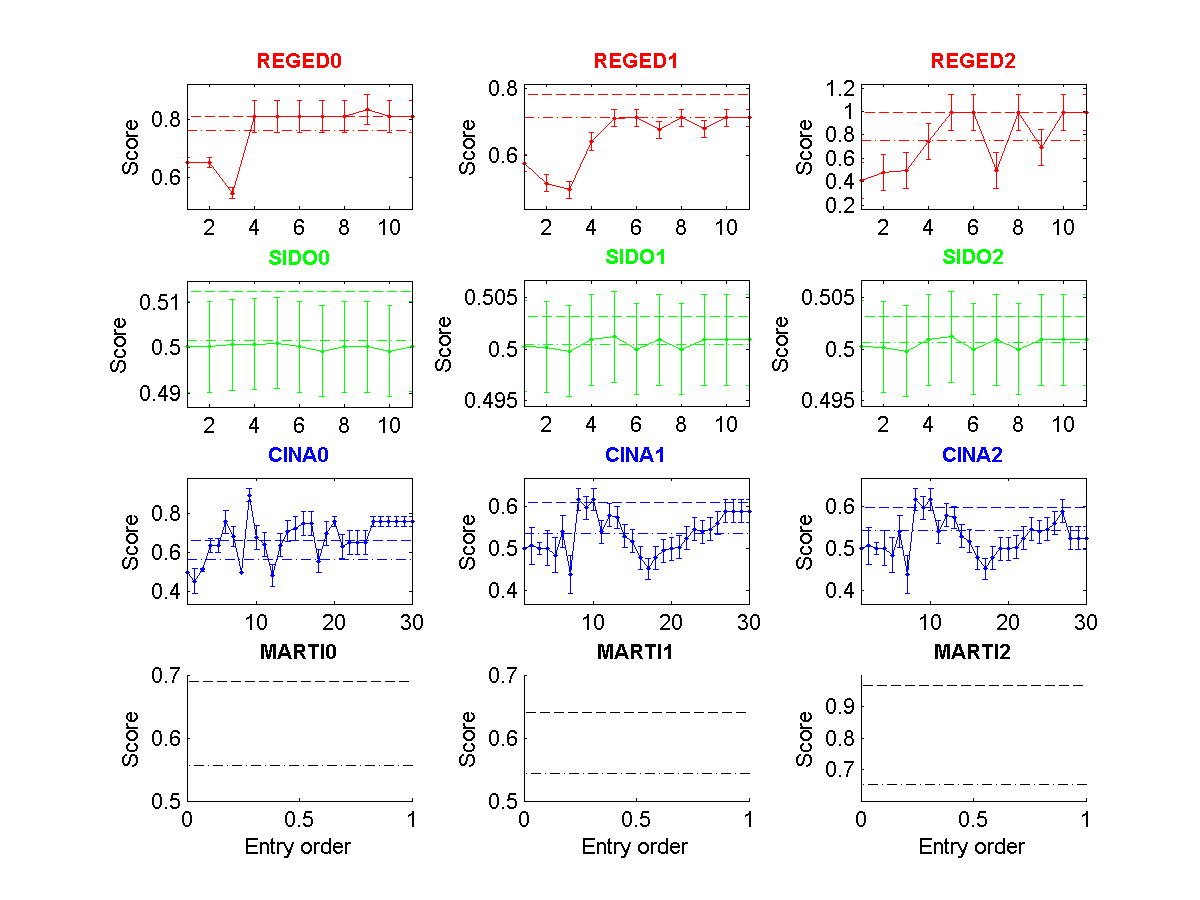
Figure 4: Fscore of all entries made as a function of entry order. (Click to enlarge). The dashed lines indicate the 25 and 50 percentiles.
| * | Entry | Method | Fnum | Fscore | Tscore (Ts) | Top Ts | Max Ts | <Tscore> | Rank |
| REGED0 | 1444 | submission | 14/999 ** | 0.8088 | 0.9933Ý0.0014 | 1.0000 | 1.0000 | ||
| REGED1 | 1444 | submission | 1/999 ** | 0.7122 | 0.9528Ý0.0028 | 0.9980 | 0.9980 | 0.8559 | 9 |
| REGED2 | 1444 | submission | 14/999 ** | 0.9935 | 0.6216Ý0.0019 | 0.8600 | 0.9534 | ||
| SIDO0 | 1444 | submission | 10/4932 ** | 0.5003 | 0.9325Ý0.0074 | 0.9443 | 0.9467 | ||
| SIDO1 | 1444 | submission | 6/4932 ** | 0.5009 | 0.6660Ý0.0133 | 0.7532 | 0.7893 | 0.7509 | 7 |
| SIDO2 | 1444 | submission | 6/4932 ** | 0.5009 | 0.6541Ý0.0131 | 0.6684 | 0.7674 | ||
| CINA0 | 1444 | submission | 8/132 ** | 0.7575 | 0.9430Ý0.0033 | 0.9788 | 0.9788 | ||
| CINA1 | 1444 | submission | 46/132 ** | 0.5885 | 0.7381Ý0.0047 | 0.8977 | 0.8977 | 0.7832 | 8 |
| CINA2 | 1444 | submission | 8/132 ** | 0.5235 | 0.6685Ý0.0042 | 0.8157 | 0.8910 |
