Report for H.A. Jen |
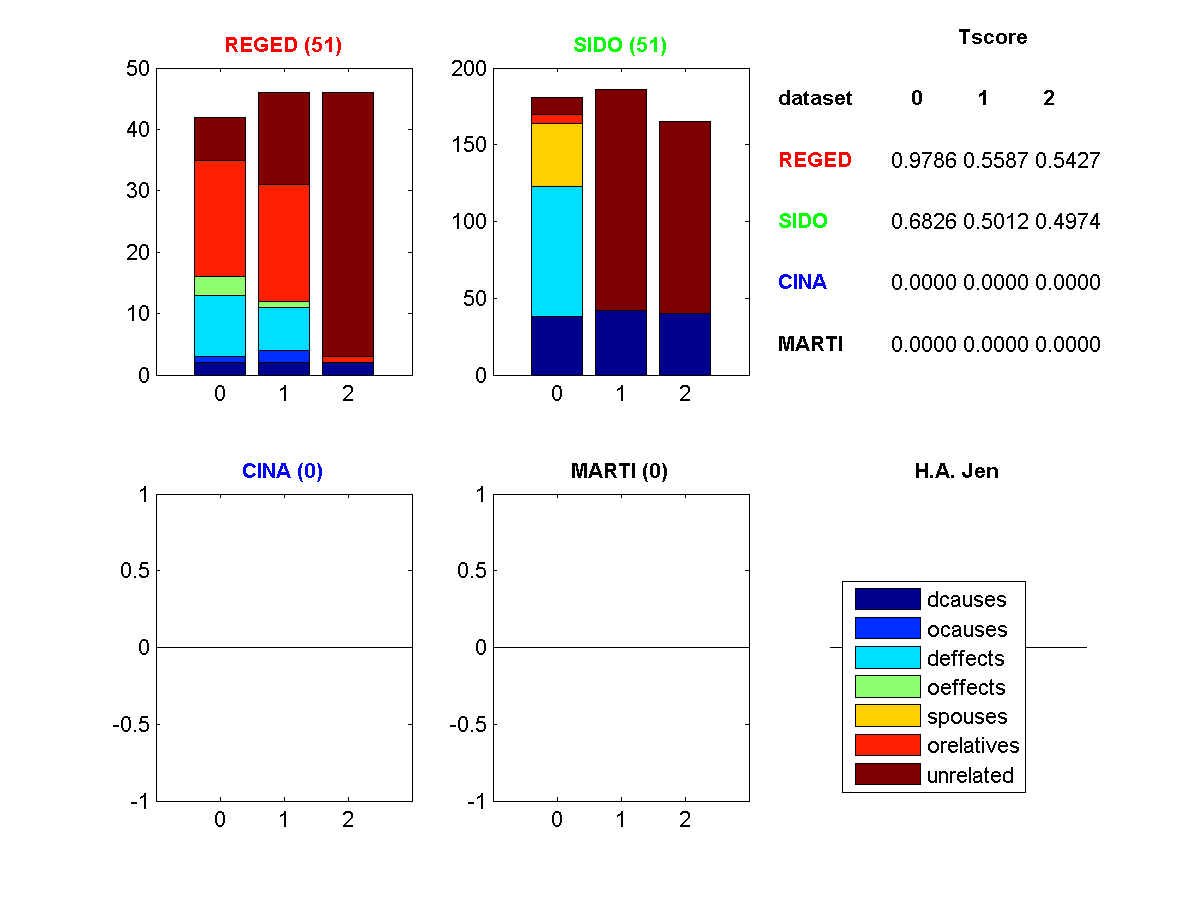
Figure 1: Profile of features selected. (Click to enlarge). Legend: dcause=direct cause, deffect=direct effects, ocauses=other causes (indirect), oeffects=other effects (indirect), spouses=parent of a direct effect, orelatives=other relatives, unrelated=completely irrelevant
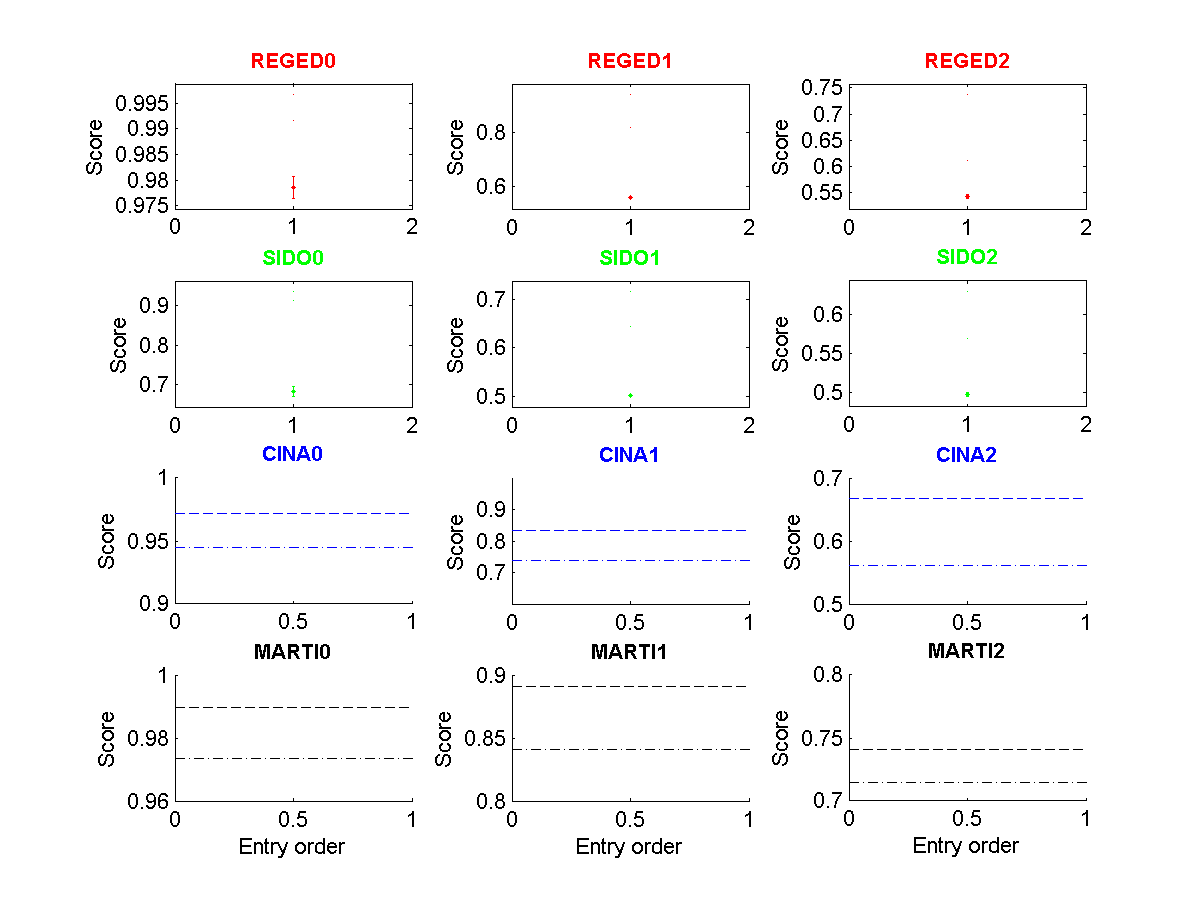
Figure 2: Tscore of all entries made as a function of entry order. (Click to enlarge). The dashed lines indicate the 25 and 50 percentiles.
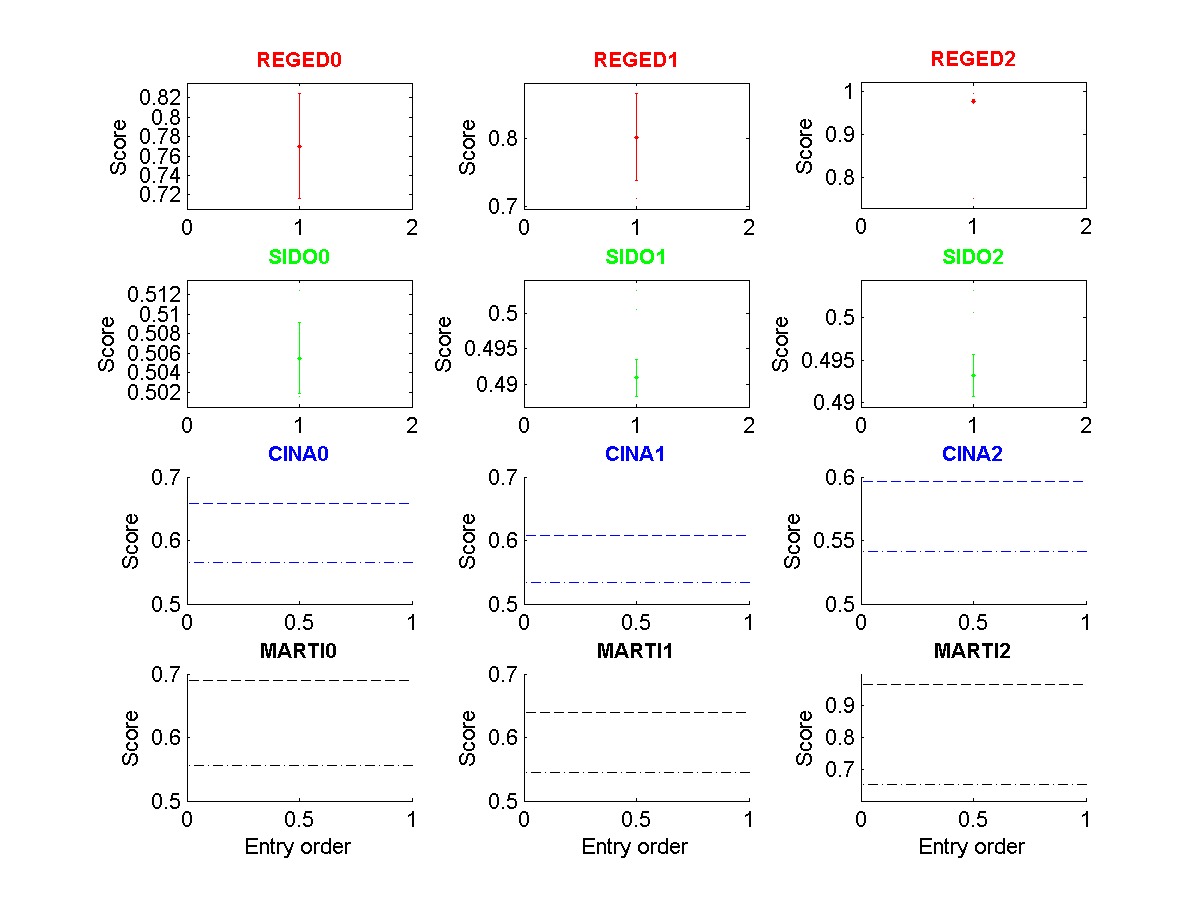
Figure 3: Fscore of all entries made as a function of entry order. (Click to enlarge). The dashed lines indicate the 25 and 50 percentiles.
| * | Entry | Method | Fnum | Fscore | Tscore (Ts) | Top Ts | Max Ts | <Tscore> | Rank |
| REGED0 | 51 | RISC Extension | 42/999 | 0.7704 | 0.9786Ý0.0022 | 1.0000 | 1.0000 | ||
| REGED1 | 51 | RISC Extension | 46/999 | 0.8026 | 0.5587Ý0.0038 | 0.9980 | 0.9980 | 0.6933 | |
| REGED2 | 51 | RISC Extension | 46/999 | 0.9779 | 0.5427Ý0.0037 | 0.8600 | 0.9534 | ||
| SIDO0 | 51 | RISC Extension | 181/4932 | 0.5055 | 0.6826Ý0.0129 | 0.9443 | 0.9467 | ||
| SIDO1 | 51 | RISC Extension | 186/4932 | 0.4909 | 0.5012Ý0.0015 | 0.7532 | 0.7893 | 0.5604 | |
| SIDO2 | 51 | RISC Extension | 165/4932 | 0.4932 | 0.4974Ý0.0028 | 0.6684 | 0.7674 |
