Report for J.G. Castellano |
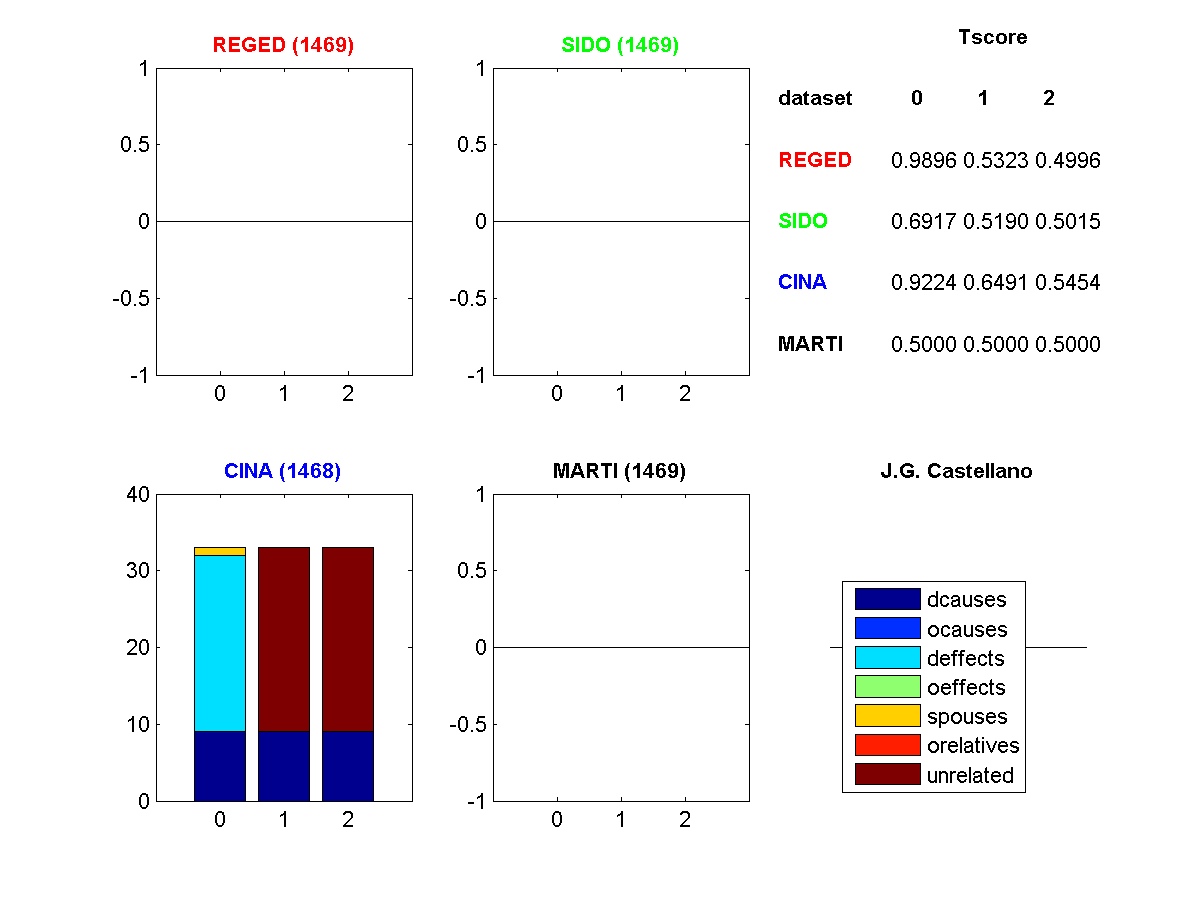
Figure 1: Profile of features selected. (Click to enlarge). Legend: dcause=direct cause, deffect=direct effects, ocauses=other causes (indirect), oeffects=other effects (indirect), spouses=parent of a direct effect, orelatives=other relatives, unrelated=completely irrelevant
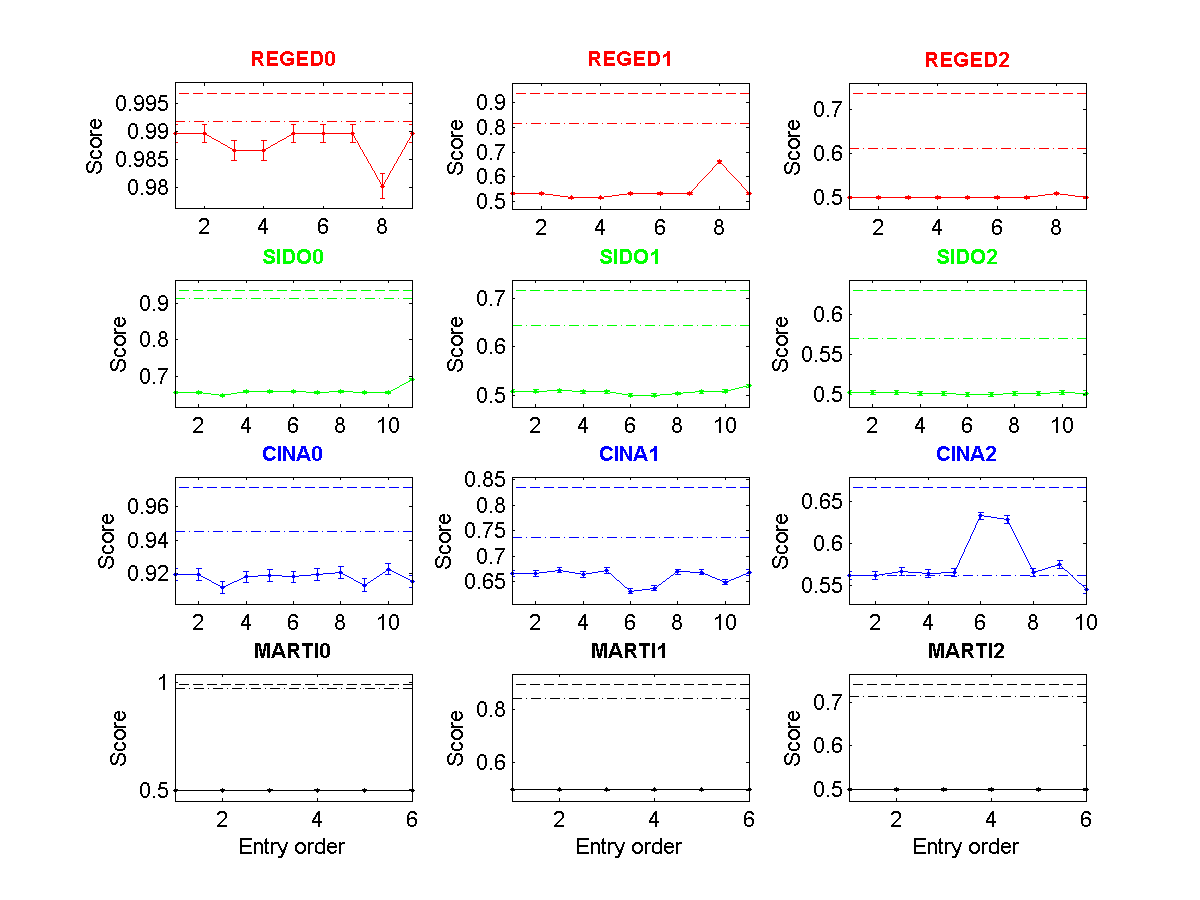
Figure 2: Tscore of all entries made as a function of entry order. (Click to enlarge). The dashed lines indicate the 25 and 50 percentiles.

Figure 3: Fscore of all entries made as a function of entry order. (Click to enlarge). The dashed lines indicate the 25 and 50 percentiles.
| * | Entry | Method | Fnum | Fscore | Tscore (Ts) | Top Ts | Max Ts | <Tscore> | Rank |
| REGED0 | 1469 | C-RPDAG | 999/999 | 0.0000 | 0.9896Ý0.0016 | 1.0000 | 1.0000 | ||
| REGED1 | 1469 | C-RPDAG | 999/999 | 0.0000 | 0.5323Ý0.0032 | 0.9980 | 0.9980 | 0.6738 | |
| REGED2 | 1469 | C-RPDAG | 999/999 | 0.0000 | 0.4996Ý0.0017 | 0.8600 | 0.9534 | ||
| SIDO0 | 1469 | C-RPDAG | 4932/4932 | 0.0000 | 0.6917Ý0.0027 | 0.9443 | 0.9467 | ||
| SIDO1 | 1469 | C-RPDAG | 4932/4932 | 0.0000 | 0.5190Ý0.0028 | 0.7532 | 0.7893 | 0.5707 | |
| SIDO2 | 1469 | C-RPDAG | 4932/4932 | 0.0000 | 0.5015Ý0.0027 | 0.6684 | 0.7674 | ||
| CINA0 | 1468 | C-RPDAG | 33/132 | 0.6435 | 0.9224Ý0.0034 | 0.9788 | 0.9788 | ||
| CINA1 | 1468 | C-RPDAG | 33/132 | 0.4659 | 0.6491Ý0.0054 | 0.8977 | 0.8977 | 0.7056 | |
| CINA2 | 1468 | C-RPDAG | 33/132 | 0.4659 | 0.5454Ý0.0048 | 0.8157 | 0.8910 | ||
| MARTI0 | 1469 | C-RPDAG | 1024/1024 | 0.0000 | 0.5000Ý0.0019 | 0.9996 | 0.9996 | ||
| MARTI1 | 1469 | C-RPDAG | 1024/1024 | 0.0000 | 0.5000Ý0.0019 | 0.9470 | 0.9542 | 0.5000 | |
| MARTI2 | 1469 | C-RPDAG | 1024/1024 | 0.0000 | 0.5000Ý0.0019 | 0.7975 | 0.8273 |
