Report for J. Yin & Z. Geng Gr. |

Figure 1: Profile of features selected. (Click to enlarge). Legend: dcause=direct cause, deffect=direct effects, ocauses=other causes (indirect), oeffects=other effects (indirect), spouses=parent of a direct effect, orelatives=other relatives, unrelated=completely irrelevant

Figure 2: Tscore of all entries made as a function of entry order. (Click to enlarge). The dashed lines indicate the 25 and 50 percentiles.
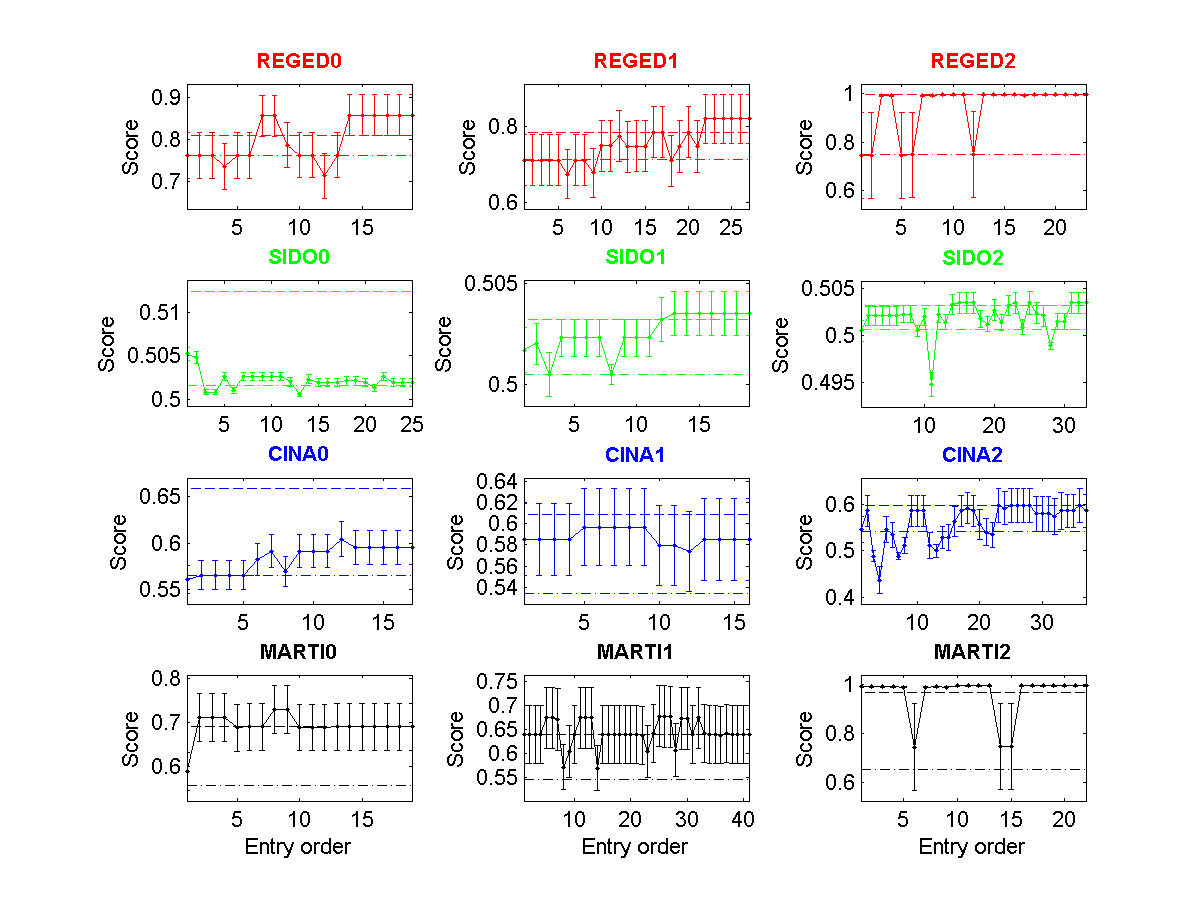
Figure 3: Fscore of all entries made as a function of entry order. (Click to enlarge). The dashed lines indicate the 25 and 50 percentiles.
| * | Entry | Method | Fnum | Fscore | Tscore (Ts) | Top Ts | Max Ts | <Tscore> | Rank |
| REGED0 | 1475 | final submission | 15/999 | 0.8571 | 0.9997Ý0.0010 | 1.0000 | 1.0000 | ||
| REGED1 | 1475 | final submission | 14/999 | 0.8189 | 0.9517Ý0.0033 | 0.9980 | 0.9980 | 0.9133 | 3 |
| REGED2 | 1475 | final submission | 11/999 | 0.9955 | 0.7885Ý0.0056 | 0.8600 | 0.9534 | ||
| SIDO0 | 1475 | final submission | 16/4932 | 0.5019 | 0.9443Ý0.0075 | 0.9443 | 0.9467 | ||
| SIDO1 | 1475 | final submission | 16/4932 | 0.5035 | 0.6976Ý0.0137 | 0.7532 | 0.7893 | 0.7609 | 5 |
| SIDO2 | 1475 | final submission | 16/4932 | 0.5035 | 0.6408Ý0.0132 | 0.6684 | 0.7674 | ||
| CINA0 | 1475 | final submission | 22/132 | 0.5957 | 0.9736Ý0.0032 | 0.9788 | 0.9788 | ||
| CINA1 | 1475 | final submission | 24/132 | 0.5852 | 0.8577Ý0.0047 | 0.8977 | 0.8977 | 0.8330 | 4 |
| CINA2 | 1475 | final submission | 18/132 | 0.5852 | 0.6676Ý0.0044 | 0.8157 | 0.8910 | ||
| MARTI0 | 1475 | final submission | 11/1024 | 0.6890 | 0.9985Ý0.0016 | 0.9996 | 0.9996 | ||
| MARTI1 | 1475 | final submission | 11/1024 | 0.6394 | 0.8911Ý0.0050 | 0.9470 | 0.9542 | 0.8955 | 2 |
| MARTI2 | 1475 | final submission | 11/1024 | 0.9956 | 0.7969Ý0.0060 | 0.7975 | 0.8273 |
