Report for Jianming Jin |
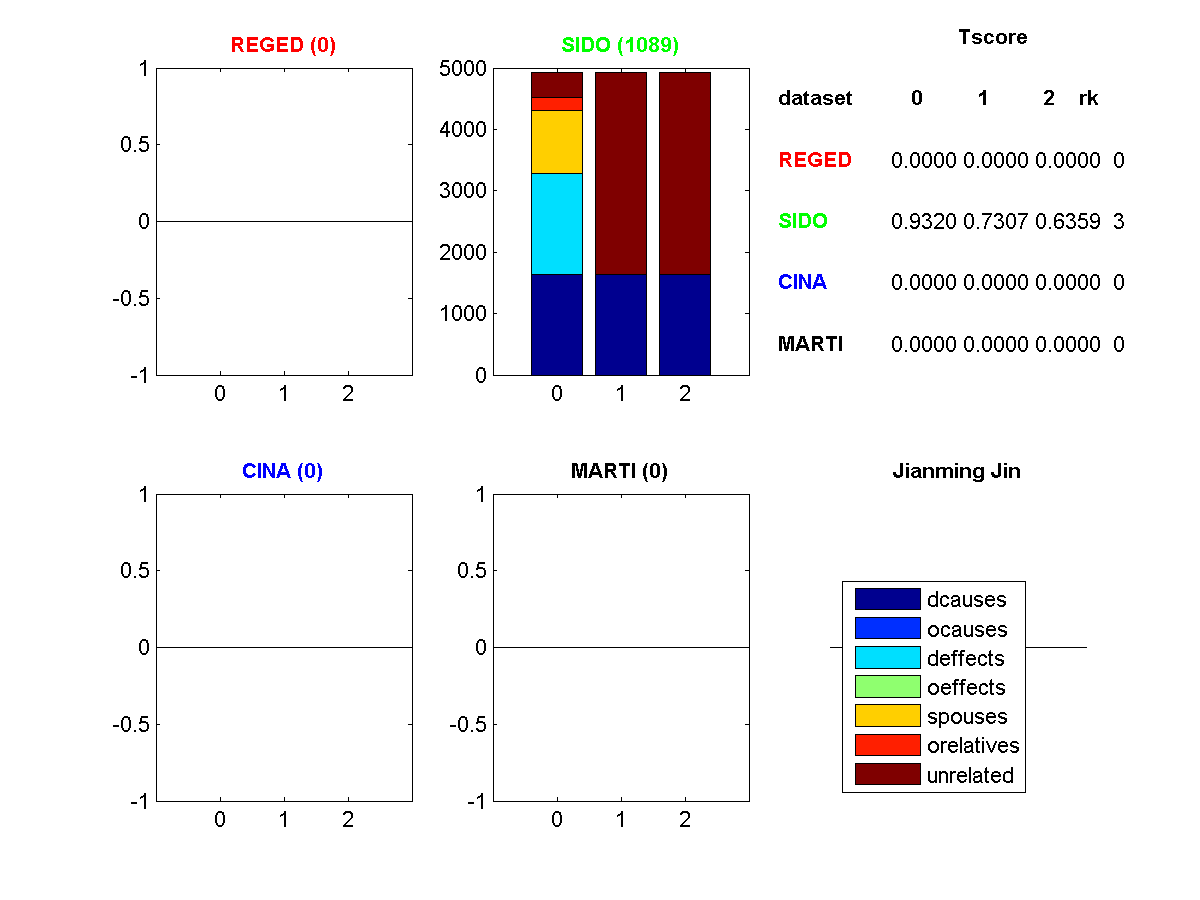
Figure 1: Profile of features selected. (Click to enlarge). Legend: dcause=direct cause, deffect=direct effects, ocauses=other causes (indirect), oeffects=other effects (indirect), spouses=parent of a direct effect, orelatives=other relatives, unrelated=completely irrelevant
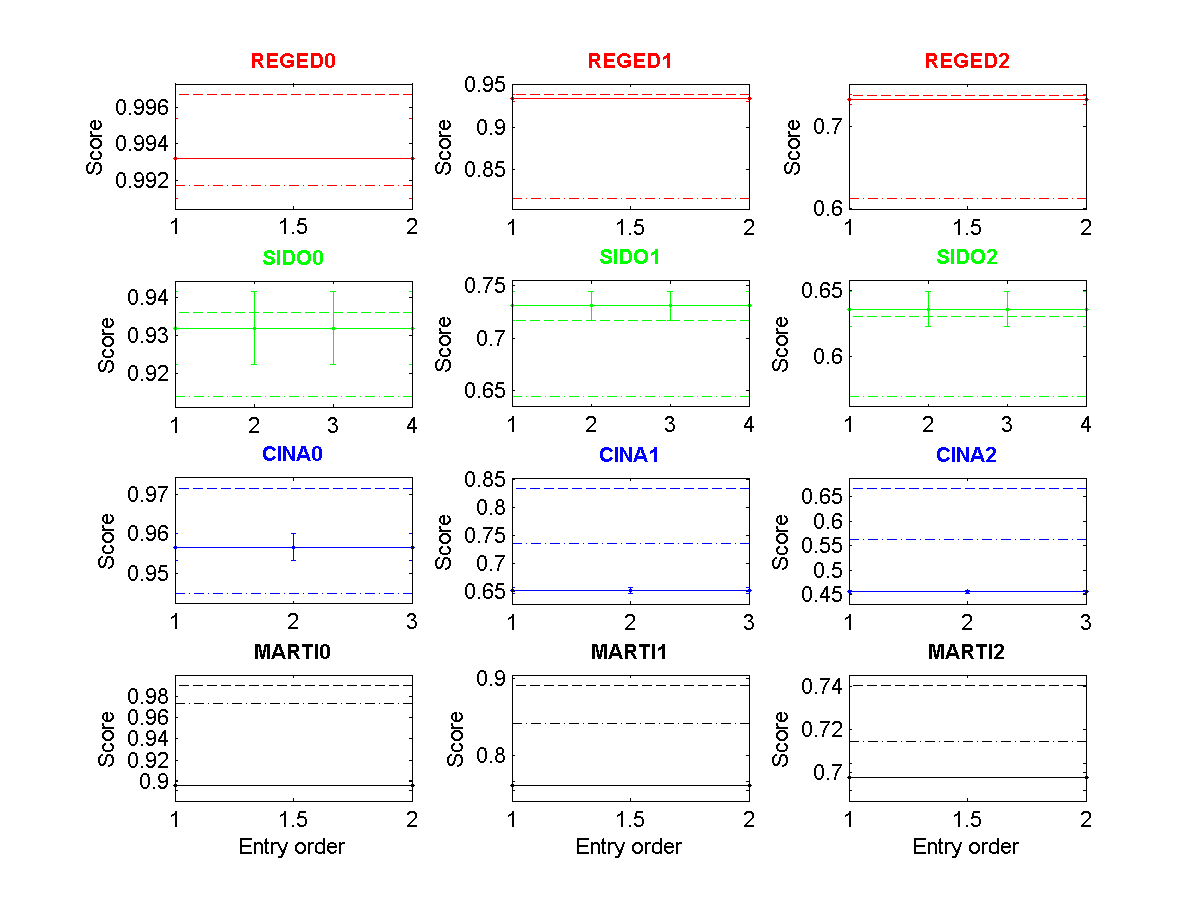
Figure 2: Tscore of all entries made as a function of entry order. (Click to enlarge). The dashed lines indicate the 25 and 50 percentiles.
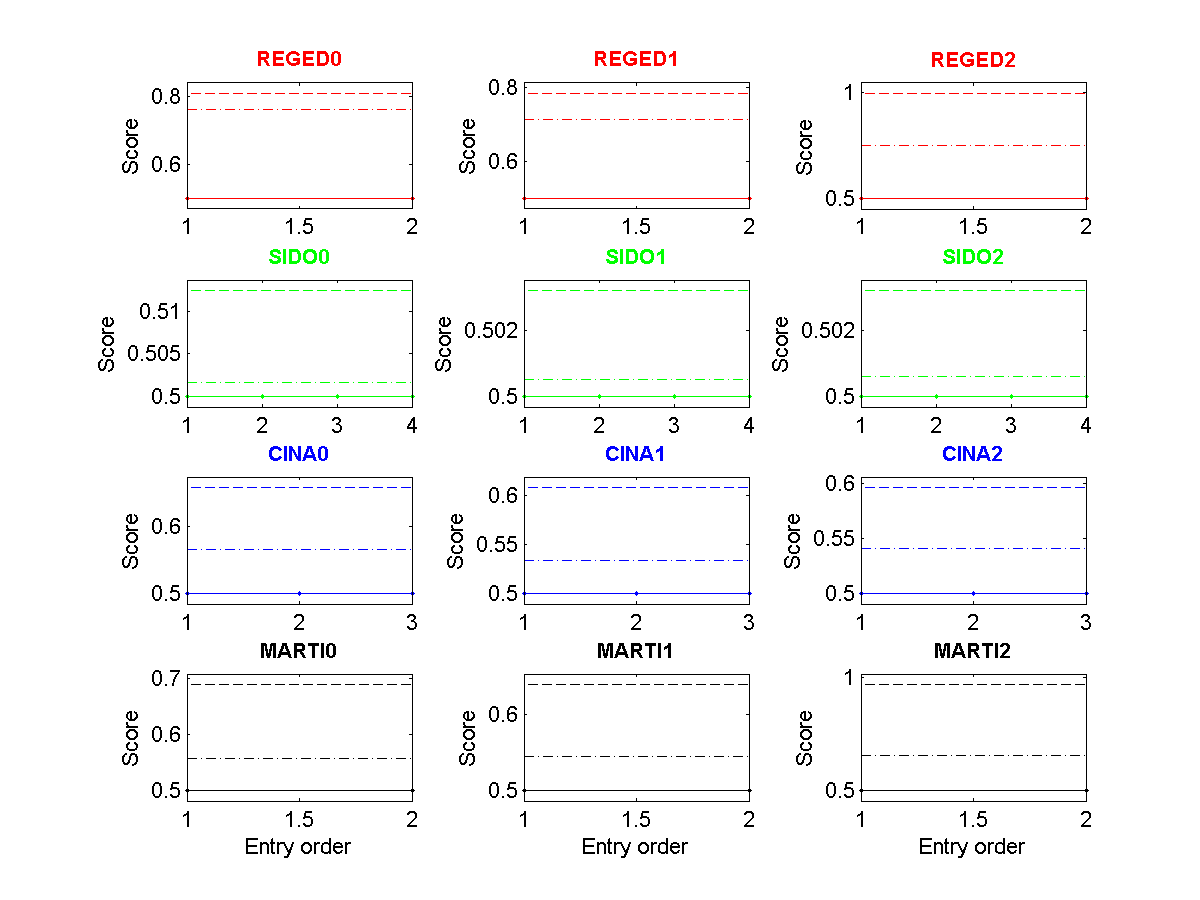
Figure 3: Fscore of all entries made as a function of entry order. (Click to enlarge). The dashed lines indicate the 25 and 50 percentiles.
| * | Entry | Method | Fnum | Fscore | Tscore (Ts) | Top Ts | Max Ts | <Tscore> | Rank |
| REGED0 | 1088 | exp 1 | 999/999 | 0.5000 | 0.9932Ý0.0022 | 1.0000 | 1.0000 | ||
| REGED1 | 1088 | exp 1 | 999/999 | 0.5000 | 0.9340Ý0.0042 | 0.9980 | 0.9980 | 0.8868 | 8 |
| REGED2 | 1088 | exp 1 | 999/999 | 0.5000 | 0.7331Ý0.0059 | 0.8600 | 0.9534 | ||
| SIDO0 | 1089 | exp 1 | 4932/4932 | 0.5000 | 0.9320Ý0.0096 | 0.9443 | 0.9467 | ||
| SIDO1 | 1089 | exp 1 | 4932/4932 | 0.5000 | 0.7307Ý0.0136 | 0.7532 | 0.7893 | 0.7662 | 3 |
| SIDO2 | 1089 | exp 1 | 4932/4932 | 0.5000 | 0.6359Ý0.0133 | 0.6684 | 0.7674 | ||
| CINA0 | 1088 | exp 1 | 132/132 | 0.5000 | 0.9566Ý0.0034 | 0.9788 | 0.9788 | ||
| CINA1 | 1088 | exp 1 | 132/132 | 0.5000 | 0.6528Ý0.0056 | 0.8977 | 0.8977 | 0.6883 | 13 |
| CINA2 | 1088 | exp 1 | 132/132 | 0.5000 | 0.4556Ý0.0035 | 0.8157 | 0.8910 | ||
| MARTI0 | 1088 | exp 1 | 1024/1024 | 0.5000 | 0.8967Ý0.0047 | 0.9996 | 0.9996 | ||
| MARTI1 | 1088 | exp 1 | 1024/1024 | 0.5000 | 0.7597Ý0.0060 | 0.9470 | 0.9542 | 0.7848 | 7 |
| MARTI2 | 1088 | exp 1 | 1024/1024 | 0.5000 | 0.6979Ý0.0063 | 0.7975 | 0.8273 |
