Report for Jinzhu Jia |
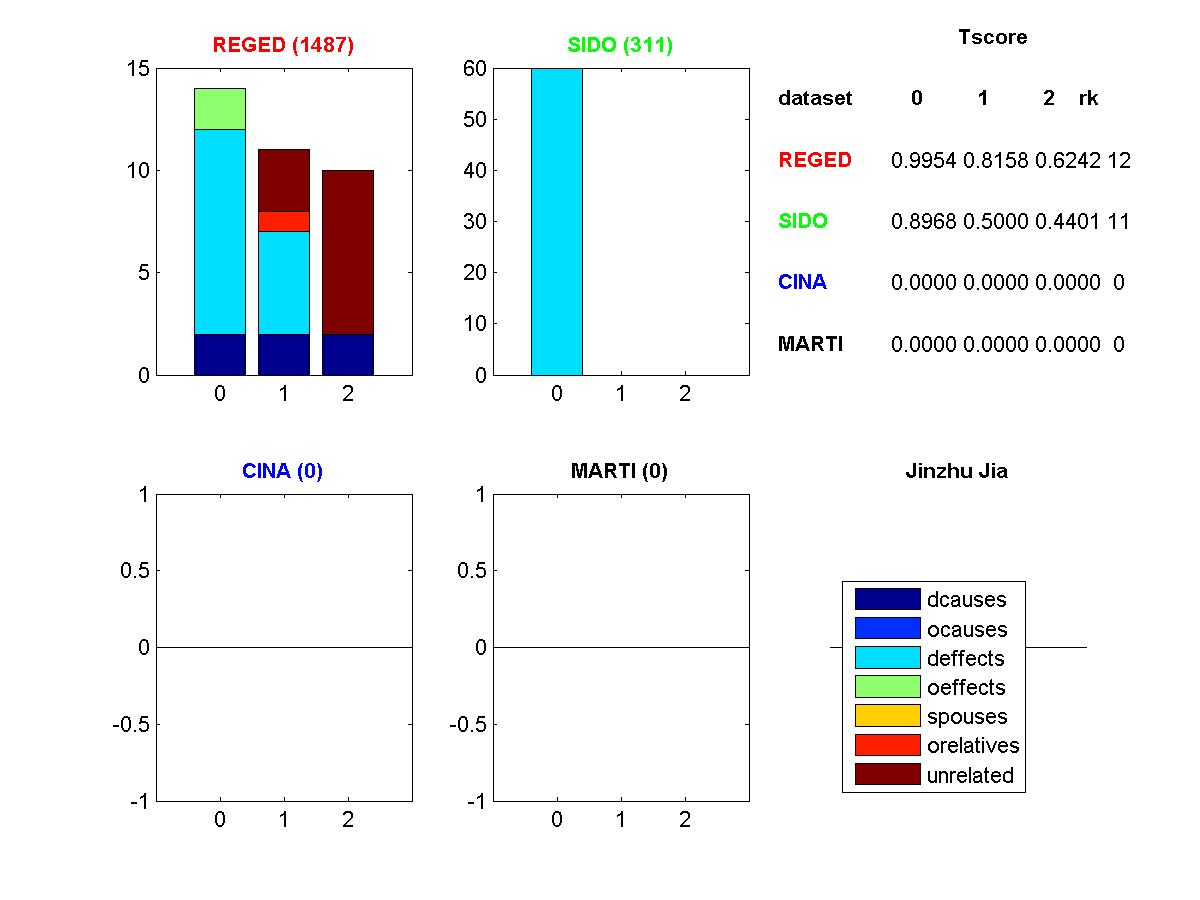
Figure 1: Profile of features selected. (Click to enlarge). Legend: dcause=direct cause, deffect=direct effects, ocauses=other causes (indirect), oeffects=other effects (indirect), spouses=parent of a direct effect, orelatives=other relatives, unrelated=completely irrelevant
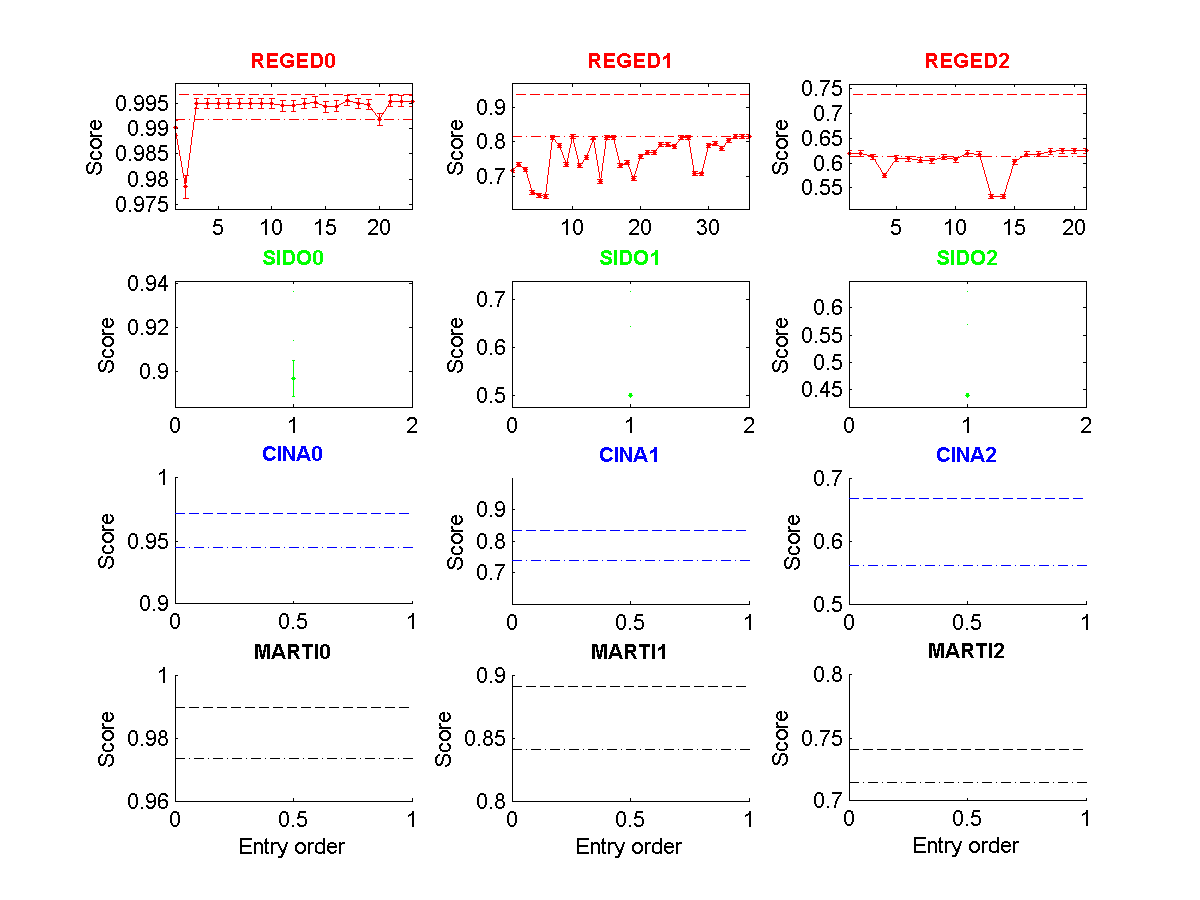
Figure 2: Tscore of all entries made as a function of entry order. (Click to enlarge). The dashed lines indicate the 25 and 50 percentiles.

Figure 3: Fscore of all entries made as a function of entry order. (Click to enlarge). The dashed lines indicate the 25 and 50 percentiles.
| * | Entry | Method | Fnum | Fscore | Tscore (Ts) | Top Ts | Max Ts | <Tscore> | Rank |
| REGED0 | 1487 | Final | 14/999 | 0.7847 | 0.9954Ý0.0010 | 1.0000 | 1.0000 | ||
| REGED1 | 1487 | Final | 11/999 | 0.7480 | 0.8158Ý0.0056 | 0.9980 | 0.9980 | 0.8118 | 12 |
| REGED2 | 1487 | Final | 10/999 | 0.9960 | 0.6242Ý0.0053 | 0.8600 | 0.9534 | ||
| SIDO0 | 311 | test | 60/4932 | 0.5070 | 0.8968Ý0.0082 | 0.9443 | 0.9467 | ||
| SIDO1 | 311 | test | 4932/4932 | 0.0000 | 0.5000Ý0.0028 | 0.7532 | 0.7893 | 0.6123 | 11 |
| SIDO2 | 311 | test | 4932/4932 | 0.0000 | 0.4401Ý0.0027 | 0.6684 | 0.7674 |
