Report for Mehreen Saeed |
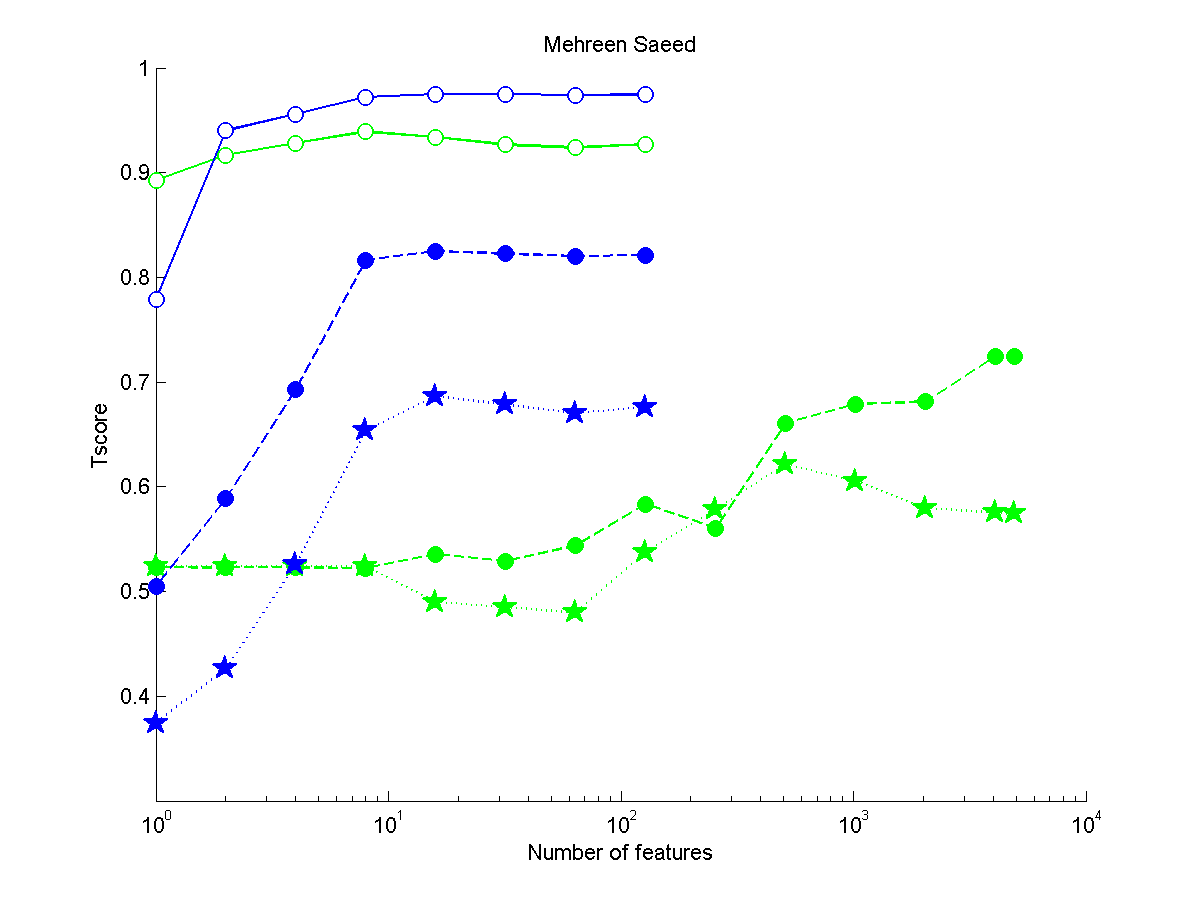
Figure 1: Performance as a function of the number of features. (Click to enlarge). Legend: red: REGED, green: SIDO, blue: CINA, black: MARTI. circle: version 1 (unmanipulated test set), full circle: version 2 (manipulated), star: version 3 (manipulated)
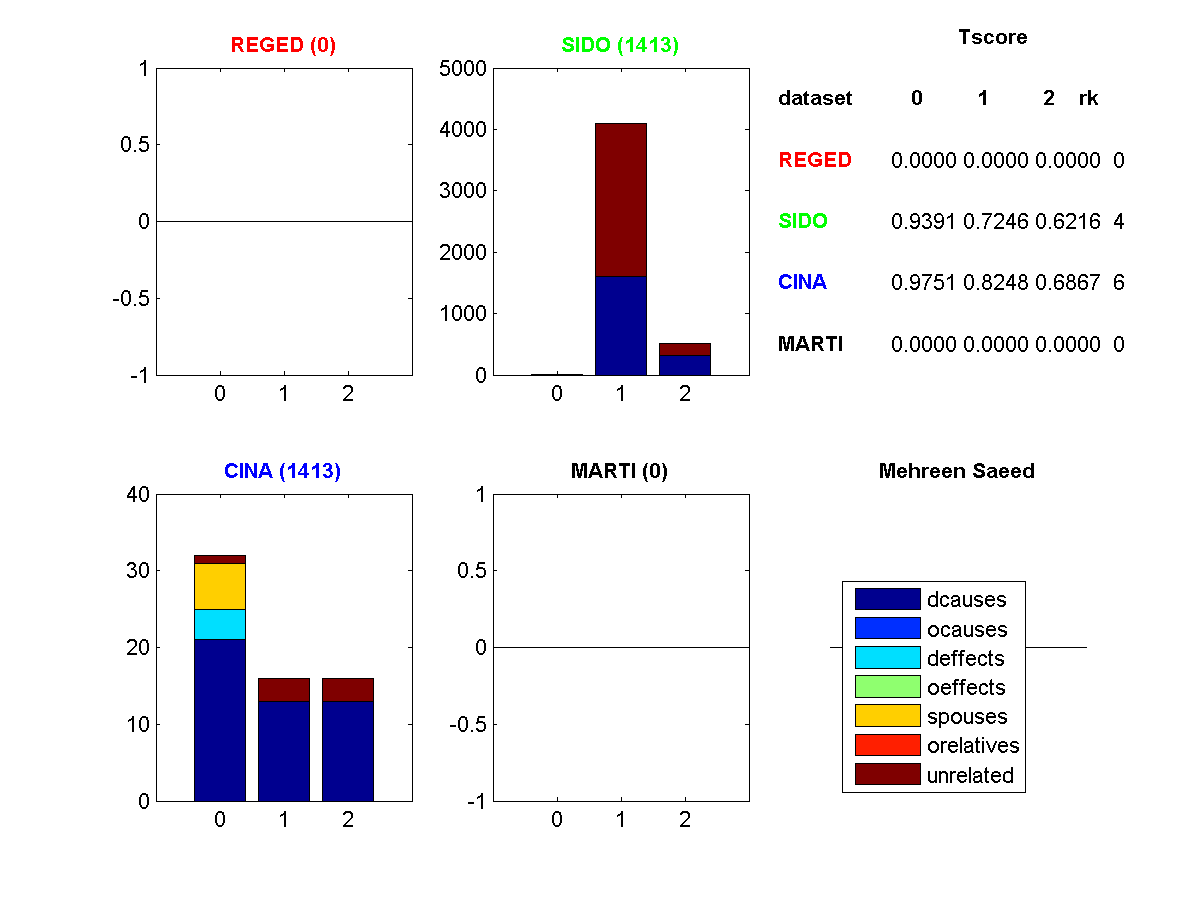
Figure 2: Profile of features selected. (Click to enlarge). Legend: dcause=direct cause, deffect=direct effects, ocauses=other causes (indirect), oeffects=other effects (indirect), spouses=parent of a direct effect, orelatives=other relatives, unrelated=completely irrelevant
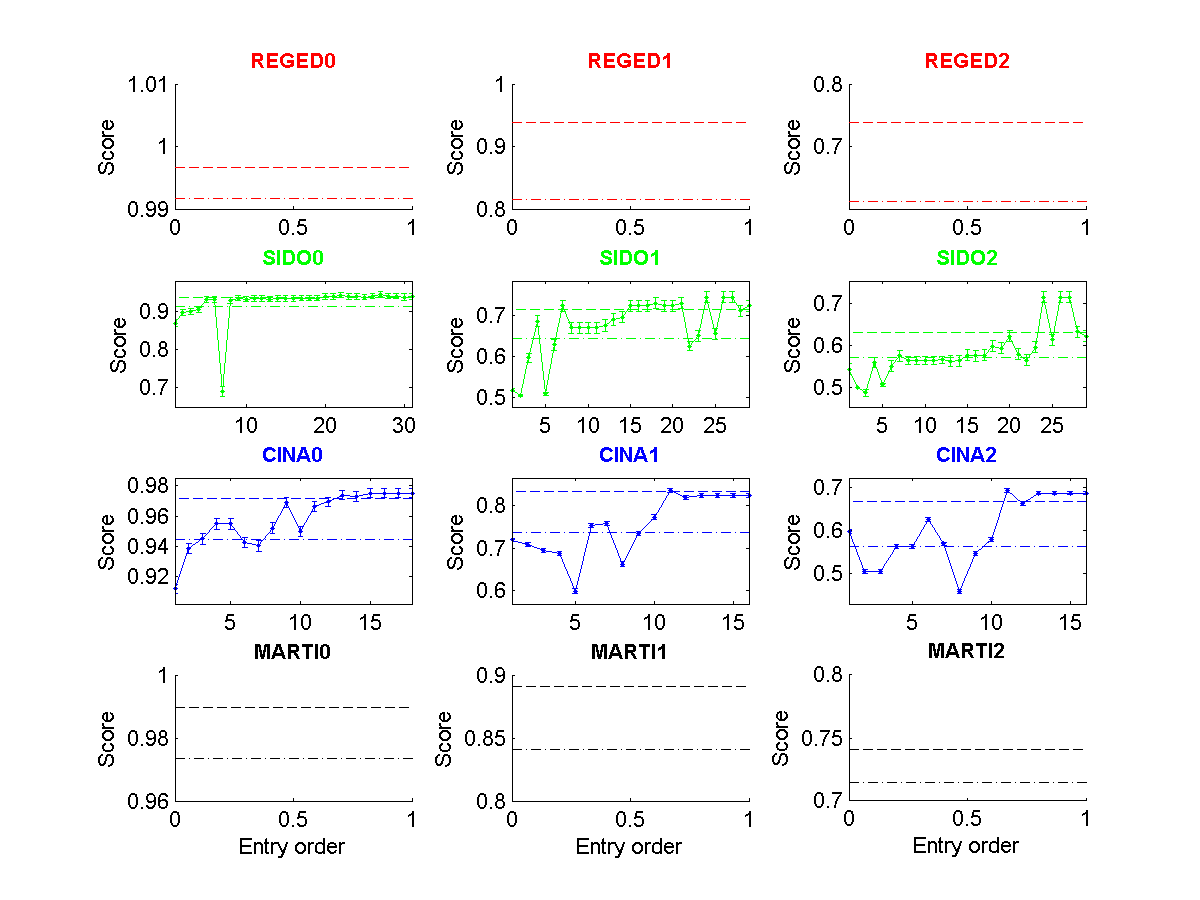
Figure 3: Tscore of all entries made as a function of entry order. (Click to enlarge). The dashed lines indicate the 25 and 50 percentiles.

Figure 4: Fscore of all entries made as a function of entry order. (Click to enlarge). The dashed lines indicate the 25 and 50 percentiles.
| * | Entry | Method | Fnum | Fscore | Tscore (Ts) | Top Ts | Max Ts | <Tscore> | Rank |
| SIDO0 | 1413 | final entry 2 | 8/4932 ** | 0.4971 | 0.9391±0.0079 | 0.9443 | 0.9467 | ||
| SIDO1 | 1413 | final entry 2 | 4096/4932 ** | 0.7242 | 0.7246±0.0137 | 0.7532 | 0.7893 | 0.7618 | 4 |
| SIDO2 | 1413 | final entry 2 | 512/4932 ** | 0.7242 | 0.6216±0.0132 | 0.6684 | 0.7674 | ||
| CINA0 | 1413 | final entry 2 | 32/132 ** | 0.5069 | 0.9751±0.0031 | 0.9788 | 0.9788 | ||
| CINA1 | 1413 | final entry 2 | 16/132 ** | 0.7858 | 0.8248±0.0045 | 0.8977 | 0.8977 | 0.8289 | 6 |
| CINA2 | 1413 | final entry 2 | 16/132 ** | 0.7858 | 0.6867±0.0041 | 0.8157 | 0.8910 |
