Report for Nistor Grozavu |
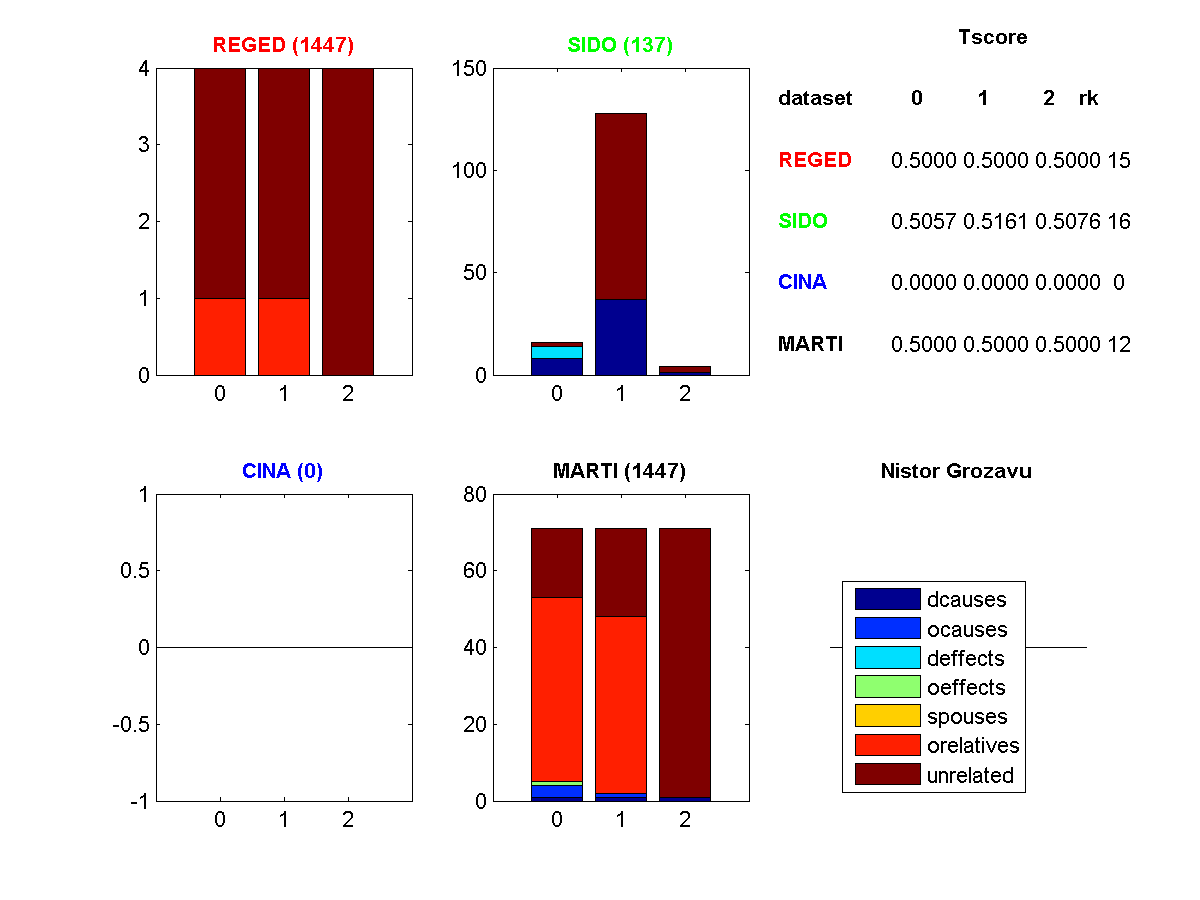
Figure 1: Profile of features selected. (Click to enlarge). Legend: dcause=direct cause, deffect=direct effects, ocauses=other causes (indirect), oeffects=other effects (indirect), spouses=parent of a direct effect, orelatives=other relatives, unrelated=completely irrelevant
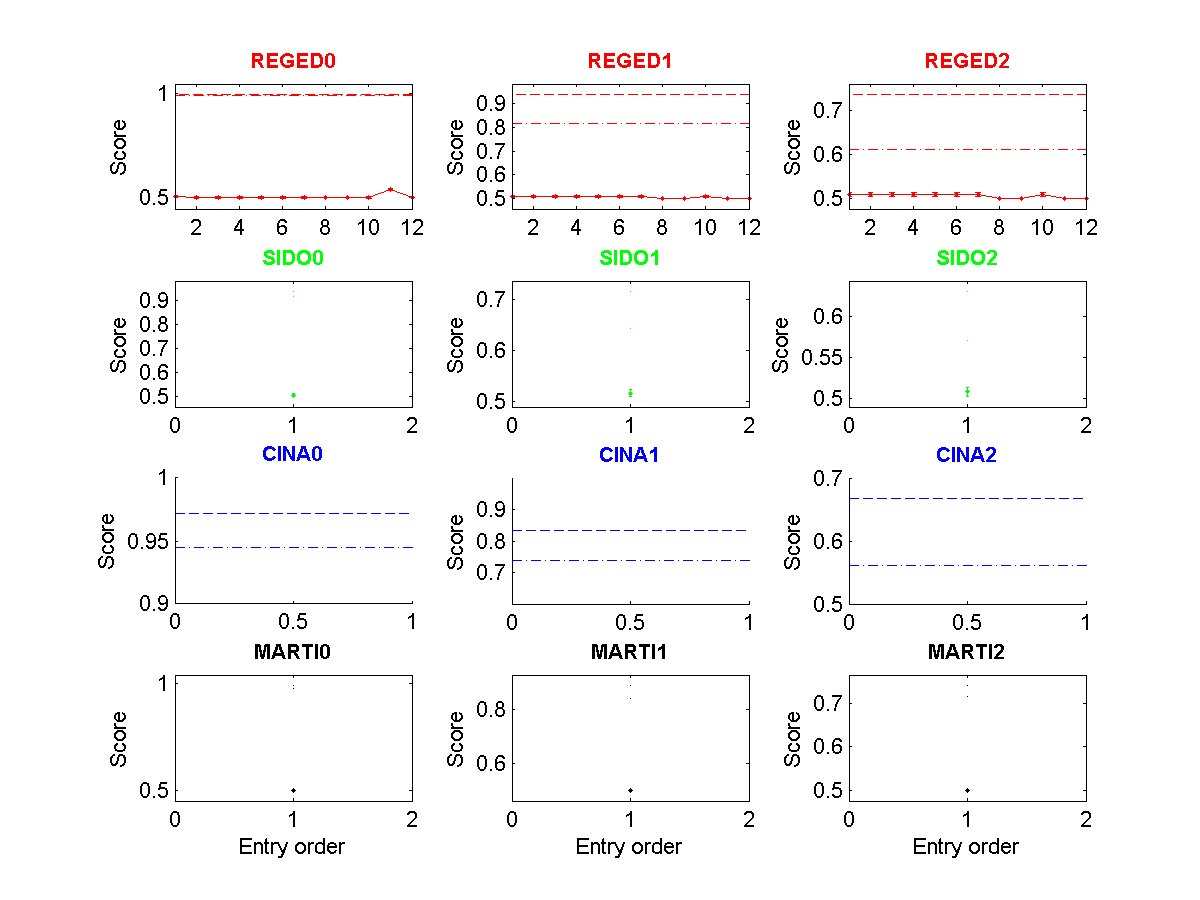
Figure 2: Tscore of all entries made as a function of entry order. (Click to enlarge). The dashed lines indicate the 25 and 50 percentiles.
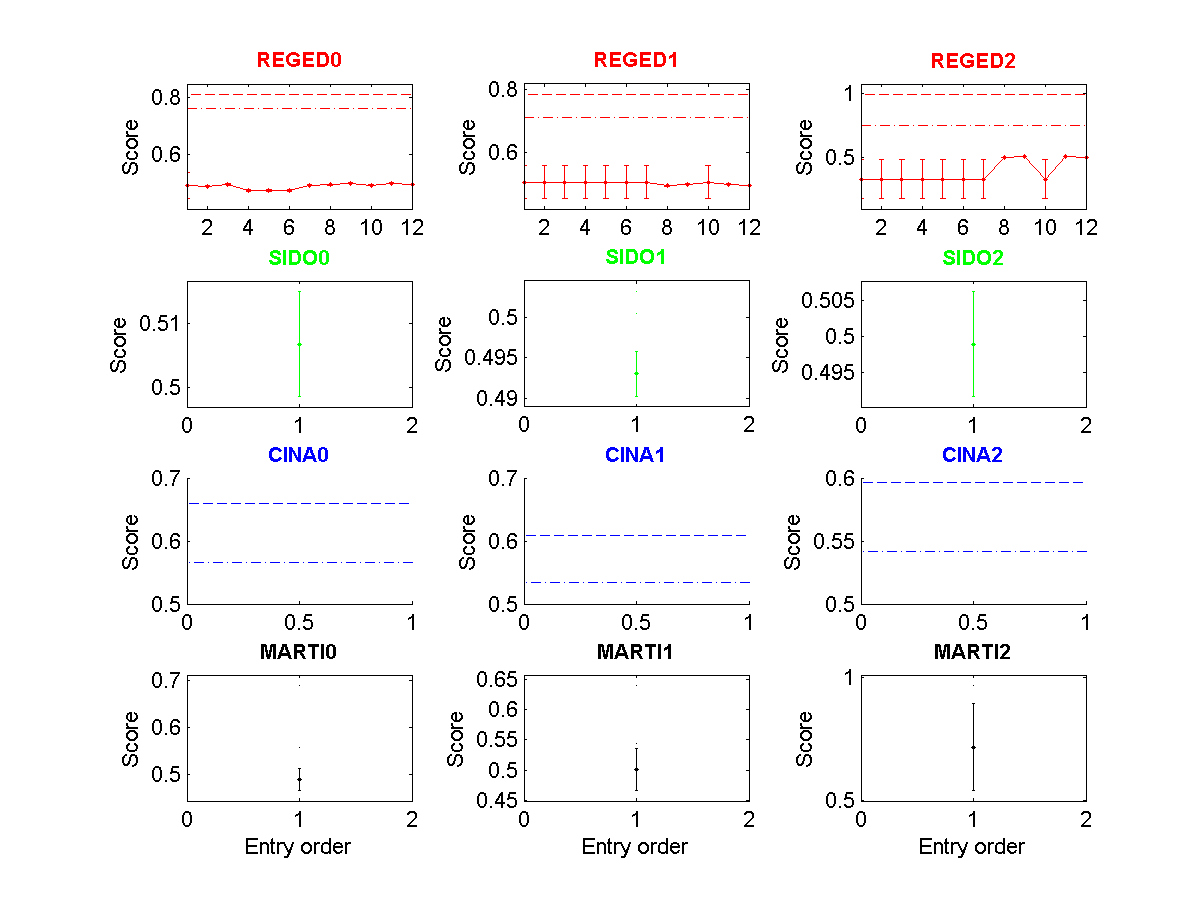
Figure 3: Fscore of all entries made as a function of entry order. (Click to enlarge). The dashed lines indicate the 25 and 50 percentiles.
| * | Entry | Method | Fnum | Fscore | Tscore (Ts) | Top Ts | Max Ts | <Tscore> | Rank |
| REGED0 | 1447 | Som | 4/999 | 0.4980 | 0.5000Ý0.0000 | 1.0000 | 1.0000 | ||
| REGED1 | 1447 | Som | 4/999 | 0.4980 | 0.5000Ý0.0000 | 0.9980 | 0.9980 | 0.5000 | 15 |
| REGED2 | 1447 | Som | 4/999 | 0.4980 | 0.5000Ý0.0000 | 0.8600 | 0.9534 | ||
| SIDO0 | 137 | fd | 16/4932 ** | 0.5068 | 0.5057Ý0.0056 | 0.9443 | 0.9467 | ||
| SIDO1 | 137 | fd | 128/4932 ** | 0.4930 | 0.5161Ý0.0068 | 0.7532 | 0.7893 | 0.5098 | 16 |
| SIDO2 | 137 | fd | 4/4932 ** | 0.4990 | 0.5076Ý0.0057 | 0.6684 | 0.7674 | ||
| MARTI0 | 1447 | Som | 71/1024 | 0.4889 | 0.5000Ý0.0000 | 0.9996 | 0.9996 | ||
| MARTI1 | 1447 | Som | 71/1024 | 0.5011 | 0.5000Ý0.0000 | 0.9470 | 0.9542 | 0.5000 | 12 |
| MARTI2 | 1447 | Som | 71/1024 | 0.7158 | 0.5000Ý0.0000 | 0.7975 | 0.8273 |
