Report for Wu Zhili |

Figure 1: Profile of features selected. (Click to enlarge). Legend: dcause=direct cause, deffect=direct effects, ocauses=other causes (indirect), oeffects=other effects (indirect), spouses=parent of a direct effect, orelatives=other relatives, unrelated=completely irrelevant

Figure 2: Tscore of all entries made as a function of entry order. (Click to enlarge). The dashed lines indicate the 25 and 50 percentiles.
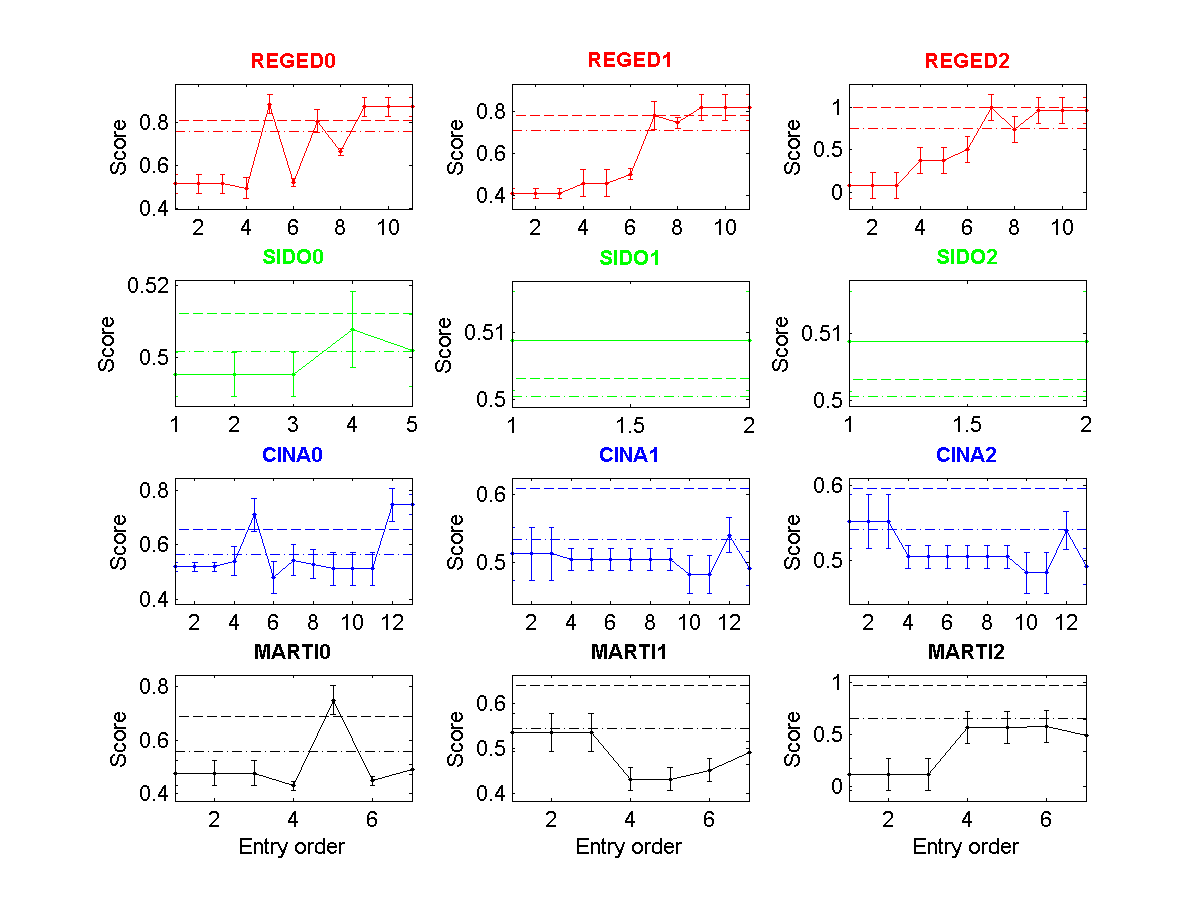
Figure 3: Fscore of all entries made as a function of entry order. (Click to enlarge). The dashed lines indicate the 25 and 50 percentiles.
| * | Entry | Method | Fnum | Fscore | Tscore (Ts) | Top Ts | Max Ts | <Tscore> | Rank |
| REGED0 | 1051 | temp 7 | 73/999 * | 0.8758 | 0.9820Ý0.0012 | 1.0000 | 1.0000 | ||
| REGED1 | 1051 | temp 7 | 73/999 * | 0.8213 | 0.8454Ý0.0051 | 0.9980 | 0.9980 | 0.8117 | 13 |
| REGED2 | 1051 | temp 7 | 73/999 * | 0.9564 | 0.6077Ý0.0056 | 0.8600 | 0.9534 | ||
| SIDO0 | 529 | wzl-03-27-v3 | 128/4932 * | 0.5021 | 0.6446Ý0.0122 | 0.9443 | 0.9467 | ||
| SIDO1 | 529 | wzl-03-27-v3 | 4932/4932 * | 0.5088 | 0.4994Ý0.0002 | 0.7532 | 0.7893 | 0.5475 | 13 |
| SIDO2 | 529 | wzl-03-27-v3 | 4932/4932 * | 0.5088 | 0.4985Ý0.0003 | 0.6684 | 0.7674 | ||
| CINA0 | 979 | temp 2 | 66/132 * | 0.7504 | 0.9210Ý0.0033 | 0.9788 | 0.9788 | ||
| CINA1 | 979 | temp 2 | 66/132 * | 0.4920 | 0.6233Ý0.0048 | 0.8977 | 0.8977 | 0.6668 | 14 |
| CINA2 | 979 | temp 2 | 66/132 * | 0.4920 | 0.4562Ý0.0042 | 0.8157 | 0.8910 | ||
| MARTI0 | 988 | temp 3 | 19/1024 * | 0.4905 | 0.6541Ý0.0058 | 0.9996 | 0.9996 | ||
| MARTI1 | 988 | temp 3 | 19/1024 * | 0.4906 | 0.6411Ý0.0060 | 0.9470 | 0.9542 | 0.6488 | 11 |
| MARTI2 | 988 | temp 3 | 19/1024 * | 0.4907 | 0.6513Ý0.0062 | 0.7975 | 0.8273 |
