Report for Yin-Wen Chang |
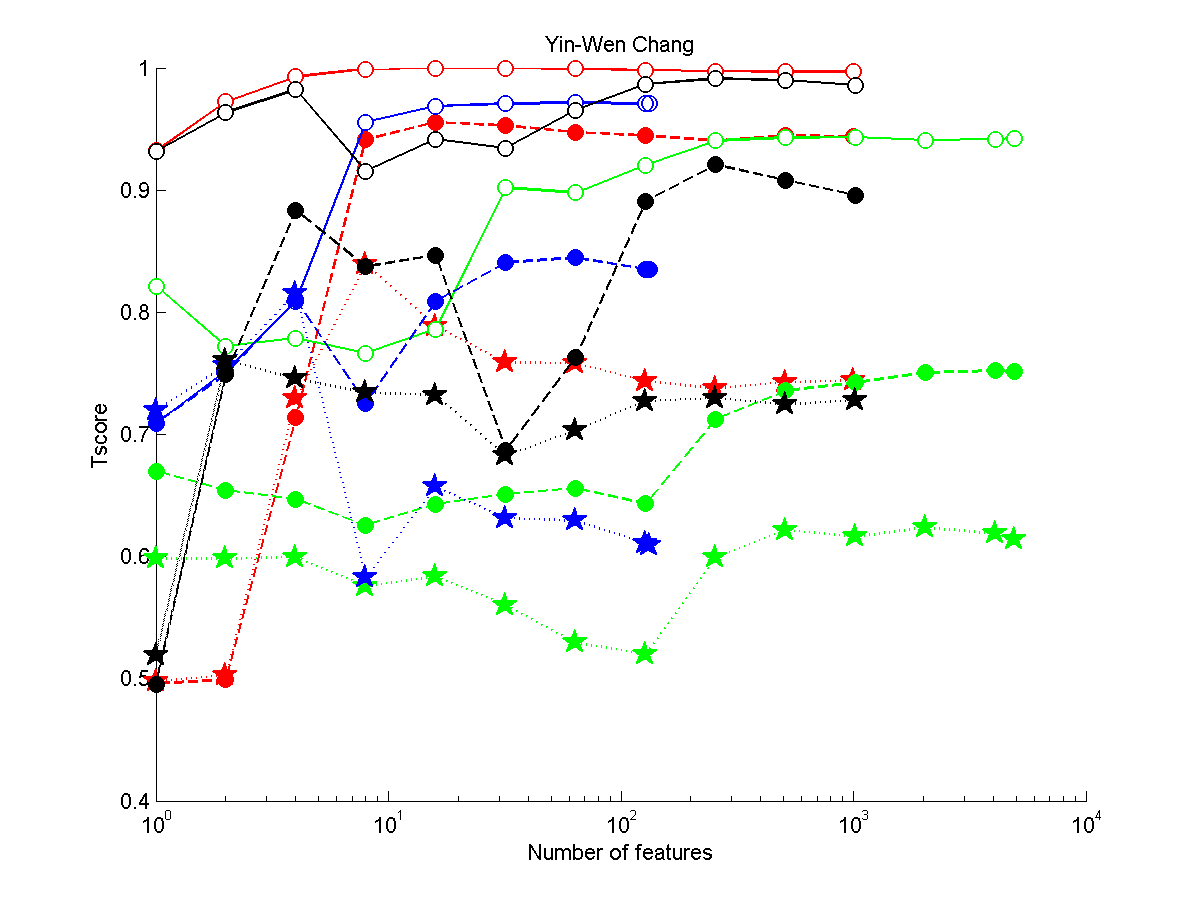
Figure 1: Performance as a function of the number of features. (Click to enlarge). Legend: red: REGED, green: SIDO, blue: CINA, black: MARTI. circle: version 1 (unmanipulated test set), full circle: version 2 (manipulated), star: version 3 (manipulated)
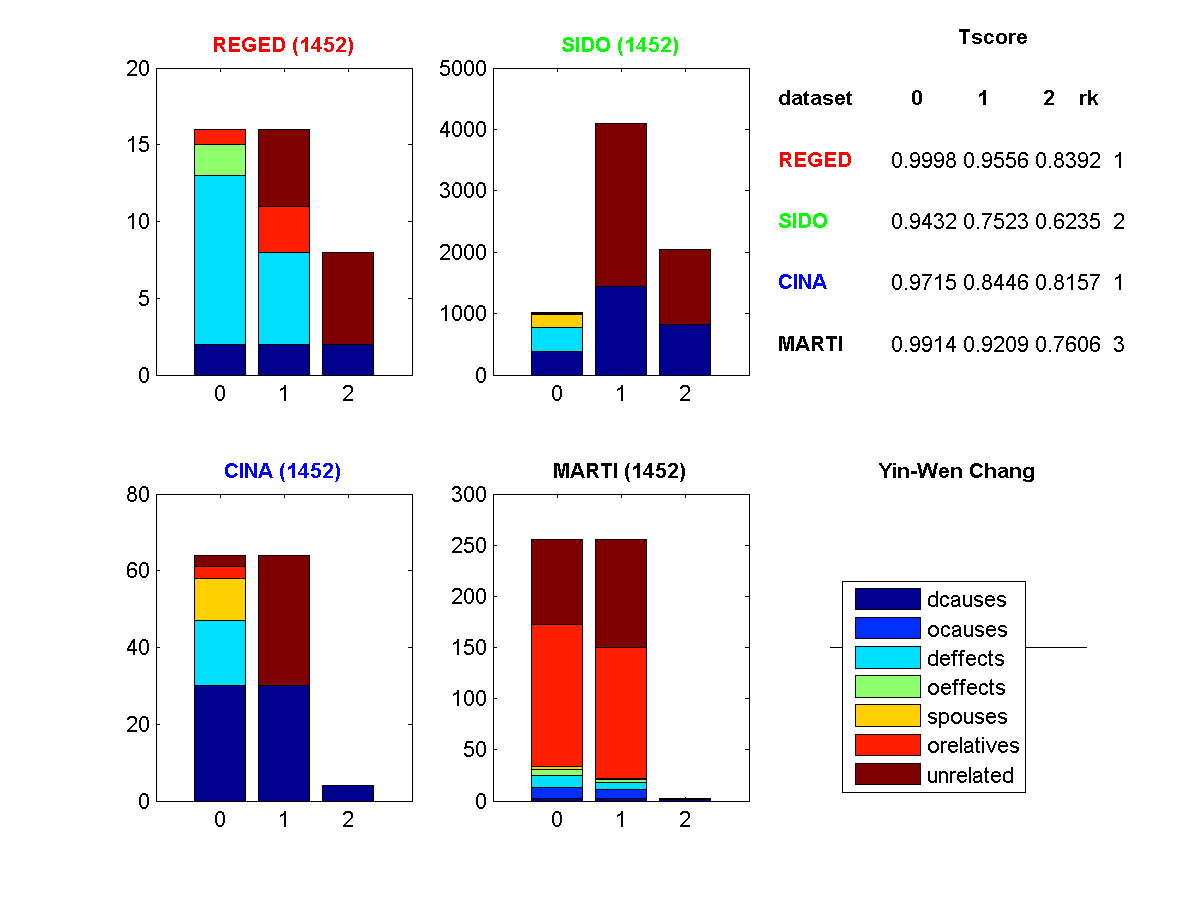
Figure 2: Profile of features selected. (Click to enlarge). Legend: dcause=direct cause, deffect=direct effects, ocauses=other causes (indirect), oeffects=other effects (indirect), spouses=parent of a direct effect, orelatives=other relatives, unrelated=completely irrelevant
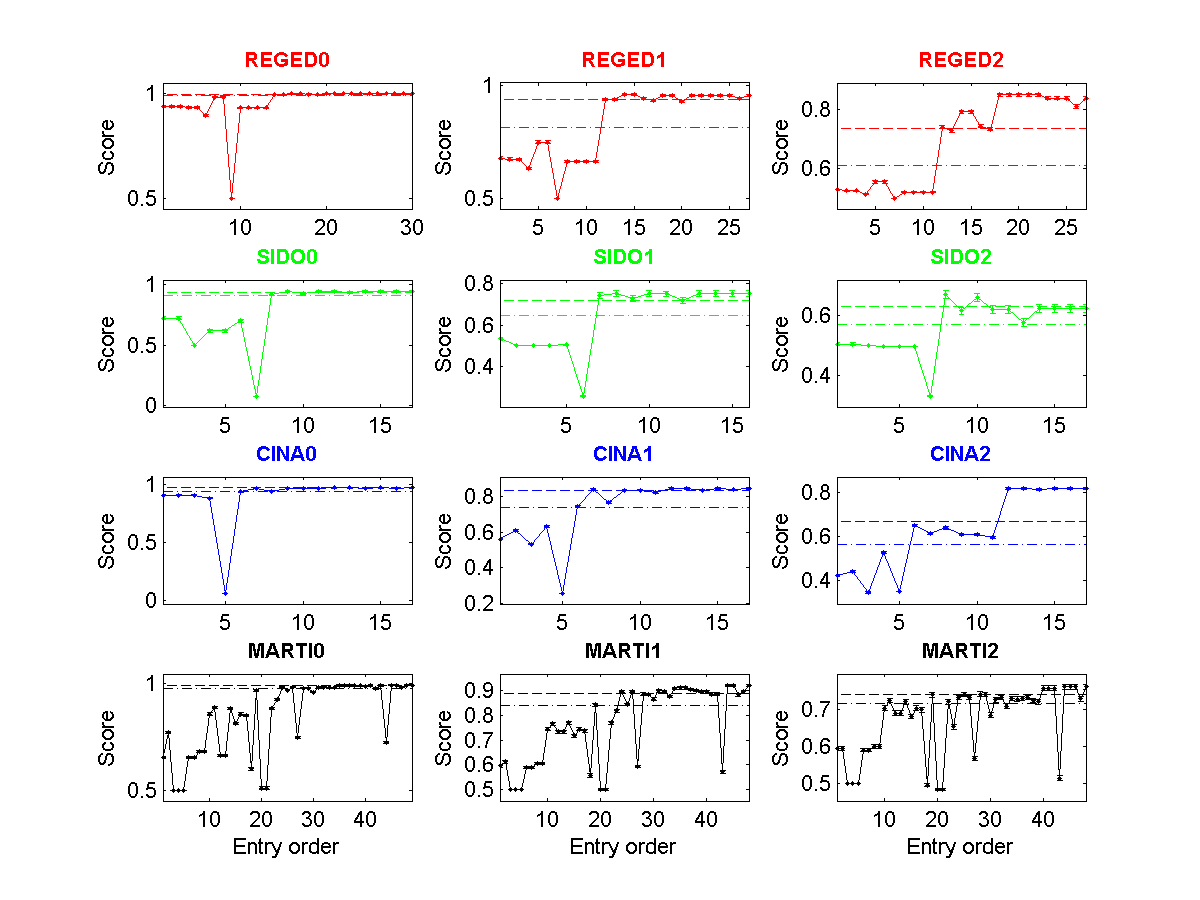
Figure 3: Tscore of all entries made as a function of entry order. (Click to enlarge). The dashed lines indicate the 25 and 50 percentiles.
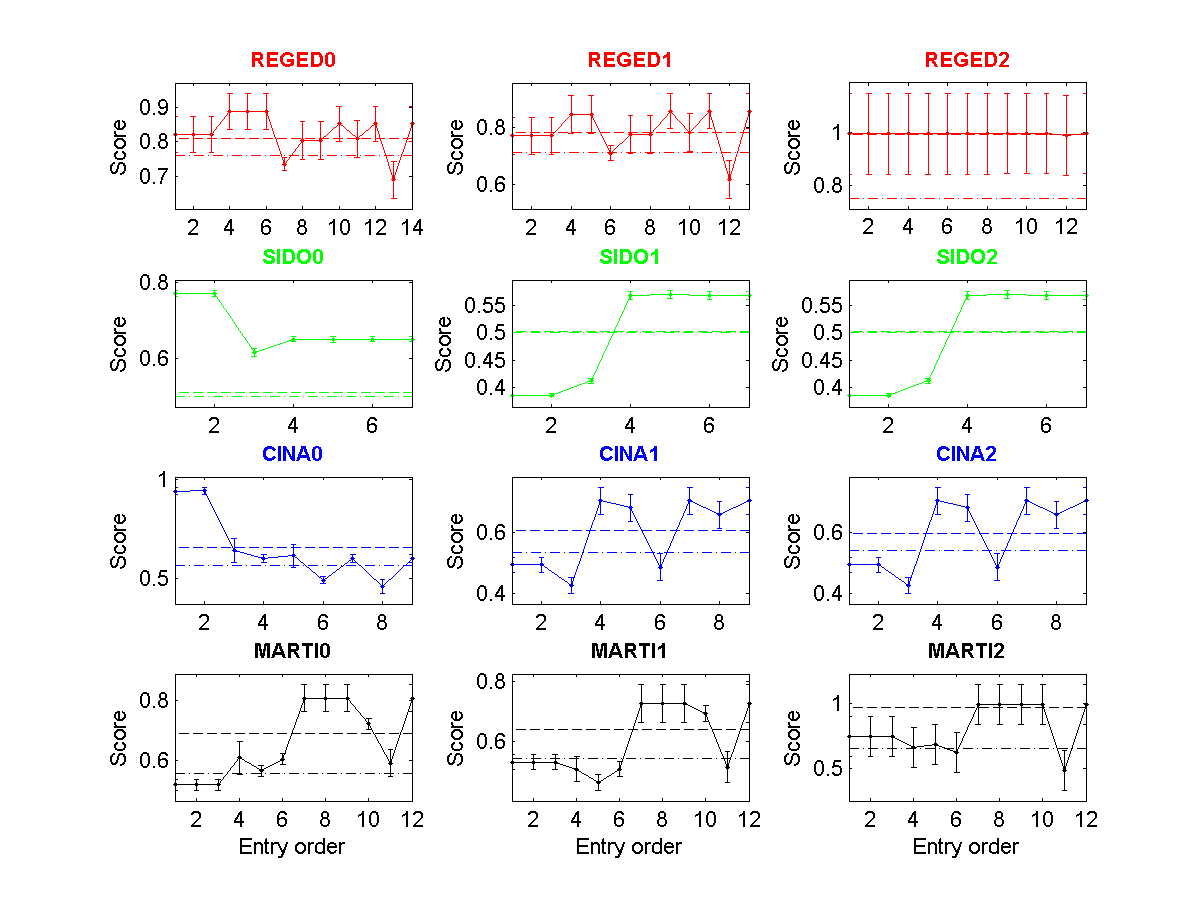
Figure 4: Fscore of all entries made as a function of entry order. (Click to enlarge). The dashed lines indicate the 25 and 50 percentiles.
| * | Entry | Method | Fnum | Fscore | Tscore (Ts) | Top Ts | Max Ts | <Tscore> | Rank |
| REGED0 | 1452 | final submission | 16/999 ** | 0.8526 | 0.9998Ý0.0009 | 1.0000 | 1.0000 | ||
| REGED1 | 1452 | final submission | 16/999 ** | 0.8566 | 0.9556Ý0.0040 | 0.9980 | 0.9980 | 0.9316 | 1 |
| REGED2 | 1452 | final submission | 8/999 ** | 0.9970 | 0.8392Ý0.0052 | 0.8600 | 0.9534 | ||
| SIDO0 | 1452 | final submission | 1024/4932 ** | 0.6516 | 0.9432Ý0.0074 | 0.9443 | 0.9467 | ||
| SIDO1 | 1452 | final submission | 4096/4932 ** | 0.5685 | 0.7523Ý0.0137 | 0.7532 | 0.7893 | 0.7730 | 2 |
| SIDO2 | 1452 | final submission | 2048/4932 ** | 0.5685 | 0.6235Ý0.0129 | 0.6684 | 0.7674 | ||
| CINA0 | 1452 | final submission | 64/132 ** | 0.6000 | 0.9715Ý0.0032 | 0.9788 | 0.9788 | ||
| CINA1 | 1452 | final submission | 64/132 ** | 0.7053 | 0.8446Ý0.0047 | 0.8977 | 0.8977 | 0.8773 | 1 |
| CINA2 | 1452 | final submission | 4/132 ** | 0.7053 | 0.8157Ý0.0052 | 0.8157 | 0.8910 | ||
| MARTI0 | 1452 | final submission | 256/1024 ** | 0.8073 | 0.9914Ý0.0025 | 0.9996 | 0.9996 | ||
| MARTI1 | 1452 | final submission | 256/1024 ** | 0.7279 | 0.9209Ý0.0045 | 0.9470 | 0.9542 | 0.8910 | 3 |
| MARTI2 | 1452 | final submission | 2/1024 ** | 0.9897 | 0.7606Ý0.0062 | 0.7975 | 0.8273 |
