Report for Florin Popescu |
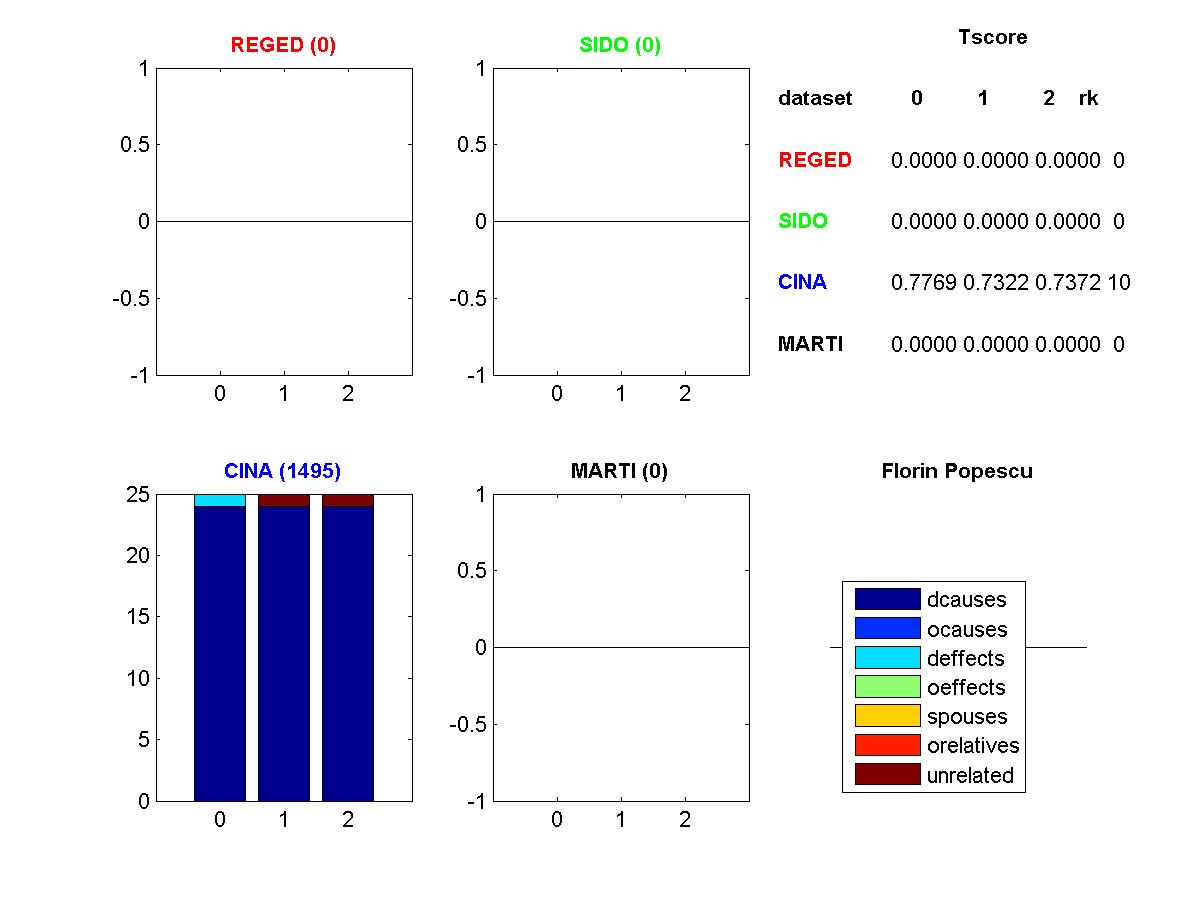
Figure 1: Profile of features selected. (Click to enlarge). Legend: dcause=direct cause, deffect=direct effects, ocauses=other causes (indirect), oeffects=other effects (indirect), spouses=parent of a direct effect, orelatives=other relatives, unrelated=completely irrelevant

Figure 2: Tscore of all entries made as a function of entry order. (Click to enlarge). The dashed lines indicate the 25 and 50 percentiles.
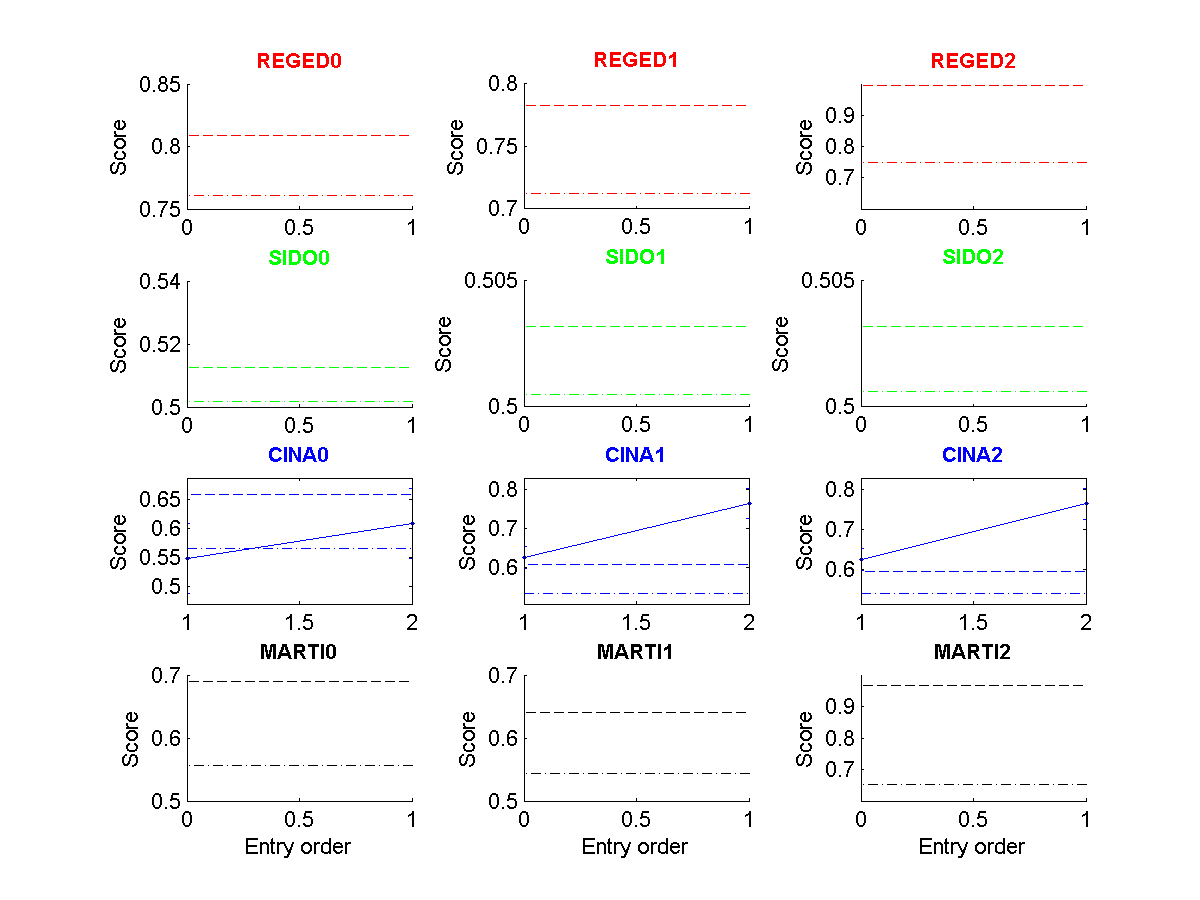
Figure 3: Fscore of all entries made as a function of entry order. (Click to enlarge). The dashed lines indicate the 25 and 50 percentiles.
| * | Entry | Method | Fnum | Fscore | Tscore (Ts) | Top Ts | Max Ts | <Tscore> | Rank |
| CINA0 | 1495 | optimally compressive regression | 25/132 * | 0.6087 | 0.7769±0.0051 | 0.9788 | 0.9788 | ||
| CINA1 | 1495 | optimally compressive regression | 25/132 * | 0.7639 | 0.7322±0.0052 | 0.8977 | 0.8977 | 0.7488 | 10 |
| CINA2 | 1495 | optimally compressive regression | 25/132 * | 0.7639 | 0.7372±0.0052 | 0.8157 | 0.8910 |
