Report for Gavin Cawley |
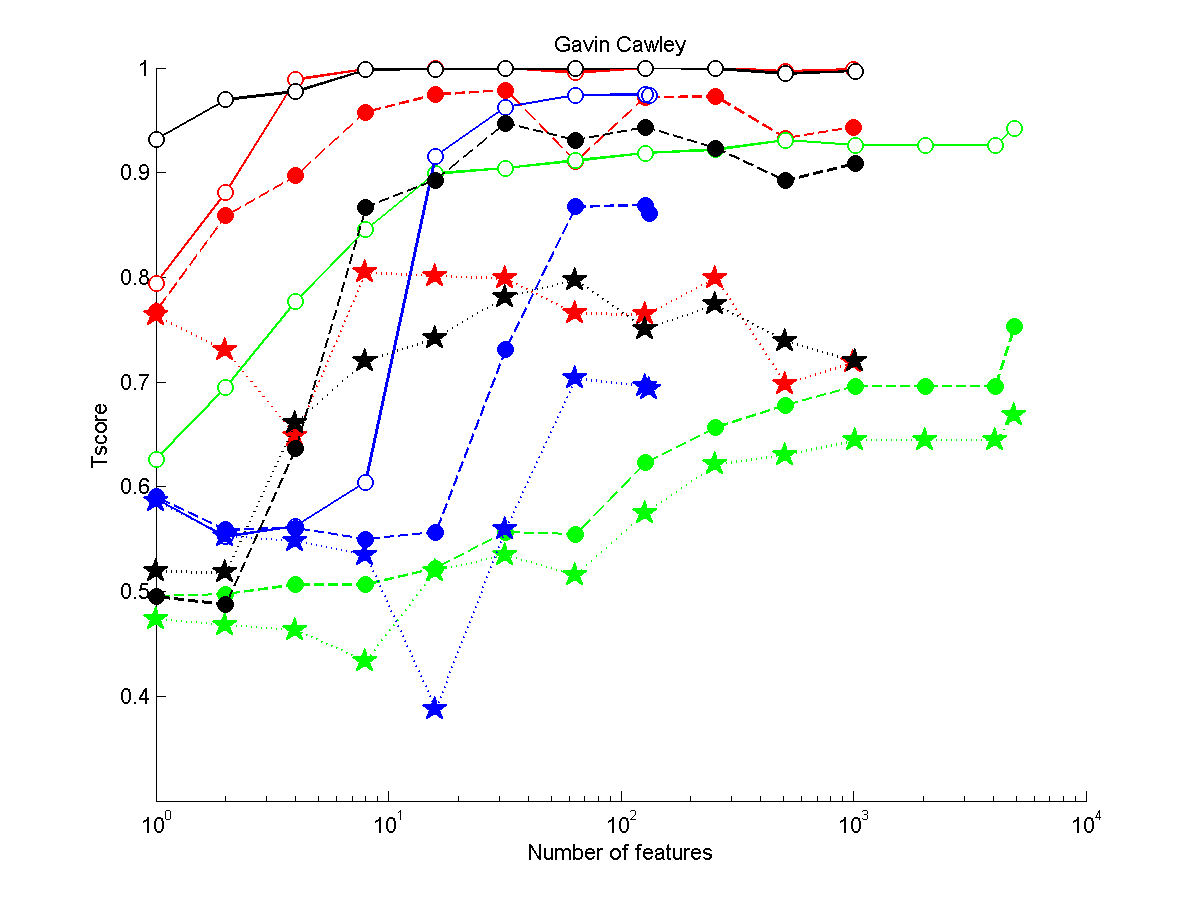
Figure 1: Performance as a function of the number of features. (Click to enlarge). Legend: red: REGED, green: SIDO, blue: CINA, black: MARTI. circle: version 1 (unmanipulated test set), full circle: version 2 (manipulated), star: version 3 (manipulated)
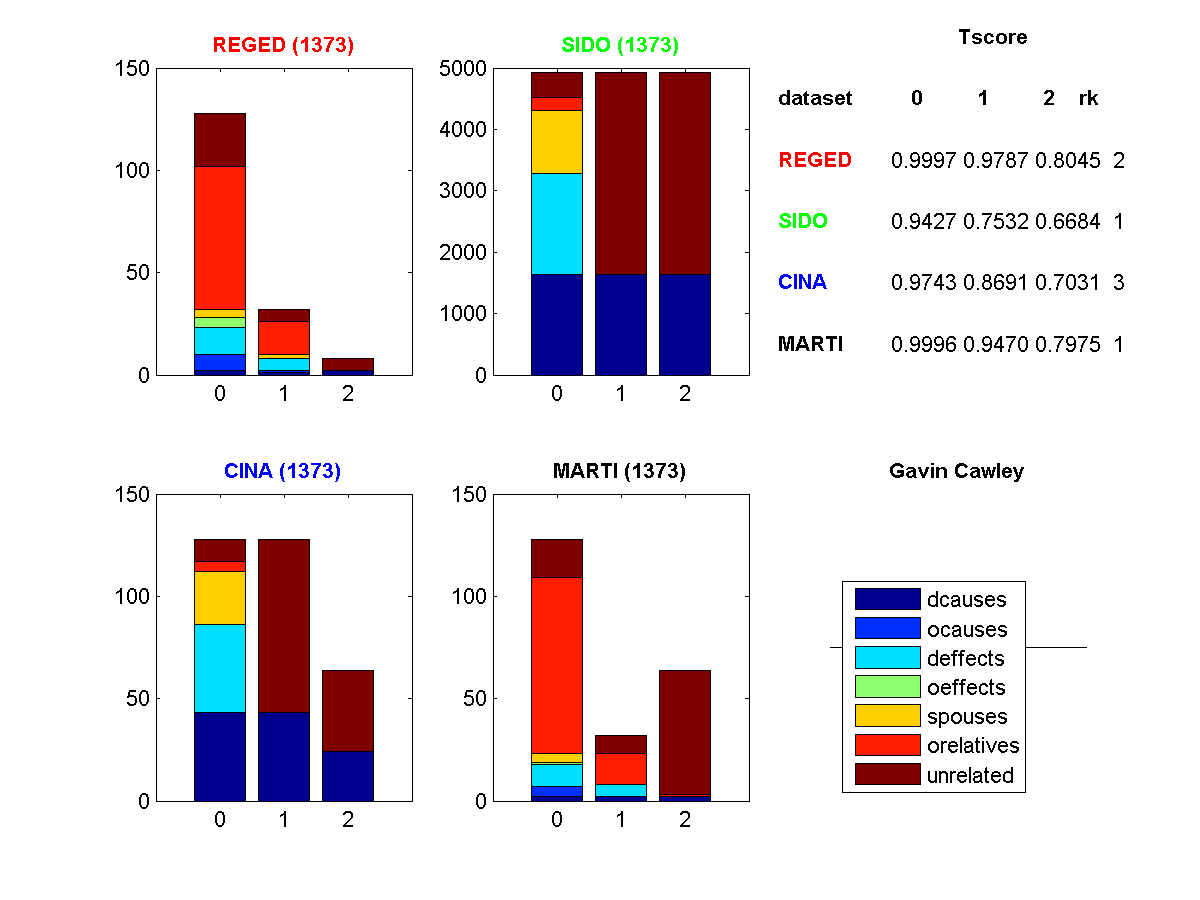
Figure 2: Profile of features selected. (Click to enlarge). Legend: dcause=direct cause, deffect=direct effects, ocauses=other causes (indirect), oeffects=other effects (indirect), spouses=parent of a direct effect, orelatives=other relatives, unrelated=completely irrelevant

Figure 3: Tscore of all entries made as a function of entry order. (Click to enlarge). The dashed lines indicate the 25 and 50 percentiles.
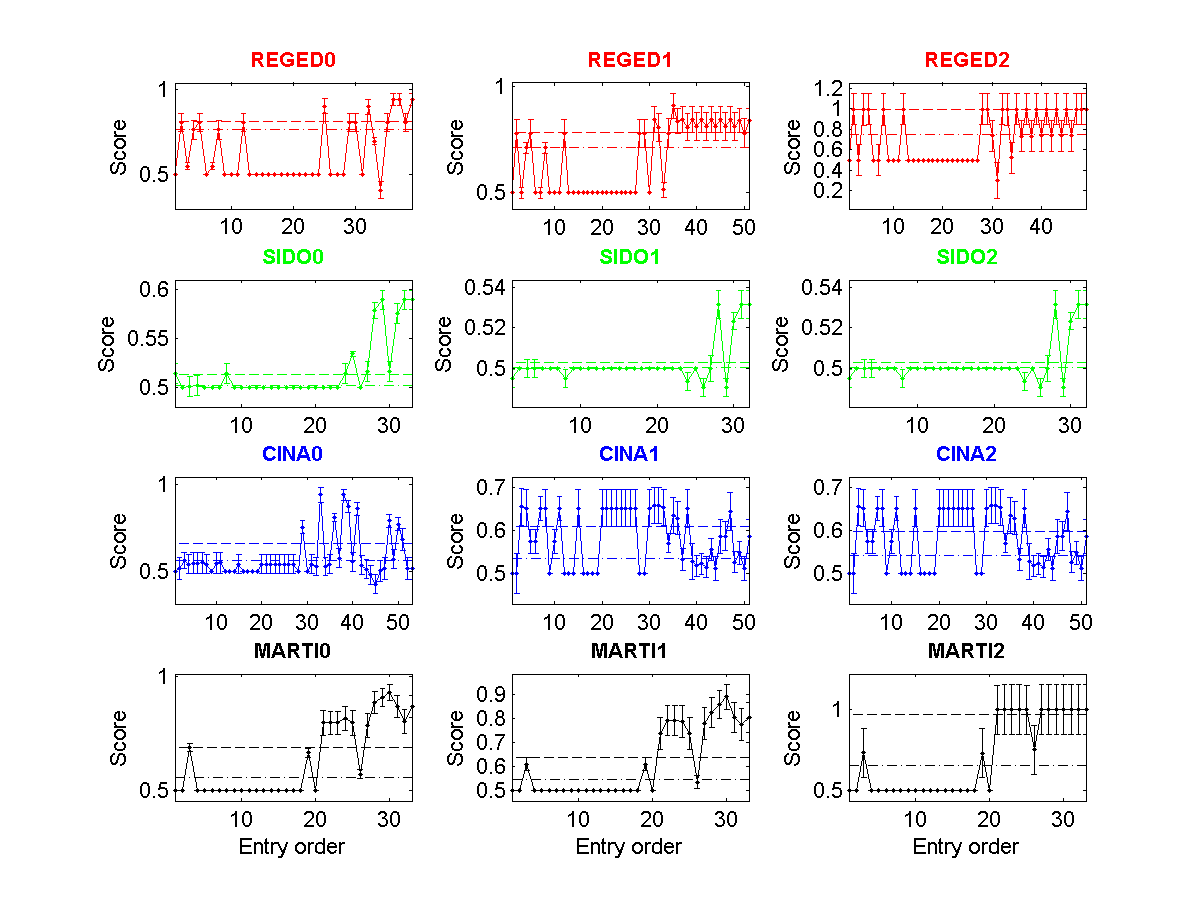
Figure 4: Fscore of all entries made as a function of entry order. (Click to enlarge). The dashed lines indicate the 25 and 50 percentiles.
| * | Entry | Method | Fnum | Fscore | Tscore (Ts) | Top Ts | Max Ts | <Tscore> | Rank |
| REGED0 | 1373 | final models | 128/999 ** | 0.9410 | 0.9997Ý0.0012 | 1.0000 | 1.0000 | ||
| REGED1 | 1373 | final models | 32/999 ** | 0.8393 | 0.9787Ý0.0036 | 0.9980 | 0.9980 | 0.9276 | 2 |
| REGED2 | 1373 | final models | 8/999 ** | 0.9985 | 0.8045Ý0.0056 | 0.8600 | 0.9534 | ||
| SIDO0 | 1373 | final models | 4928/4932 ** | 0.5890 | 0.9427Ý0.0070 | 0.9443 | 0.9467 | ||
| SIDO1 | 1373 | final models | 4928/4932 ** | 0.5314 | 0.7532Ý0.0137 | 0.7532 | 0.7893 | 0.7881 | 1 |
| SIDO2 | 1373 | final models | 4928/4932 ** | 0.5314 | 0.6684Ý0.0130 | 0.6684 | 0.7674 | ||
| CINA0 | 1373 | final models | 128/132 ** | 0.5166 | 0.9743Ý0.0031 | 0.9788 | 0.9788 | ||
| CINA1 | 1373 | final models | 128/132 ** | 0.5860 | 0.8691Ý0.0046 | 0.8977 | 0.8977 | 0.8488 | 3 |
| CINA2 | 1373 | final models | 64/132 ** | 0.5860 | 0.7031Ý0.0047 | 0.8157 | 0.8910 | ||
| MARTI0 | 1373 | final models | 128/1024 ** | 0.8697 | 0.9996Ý0.0012 | 0.9996 | 0.9996 | ||
| MARTI1 | 1373 | final models | 32/1024 ** | 0.8064 | 0.9470Ý0.0039 | 0.9470 | 0.9542 | 0.9147 | 1 |
| MARTI2 | 1373 | final models | 64/1024 ** | 0.9956 | 0.7975Ý0.0059 | 0.7975 | 0.8273 |
