Report for L.E.B & Y.T. |
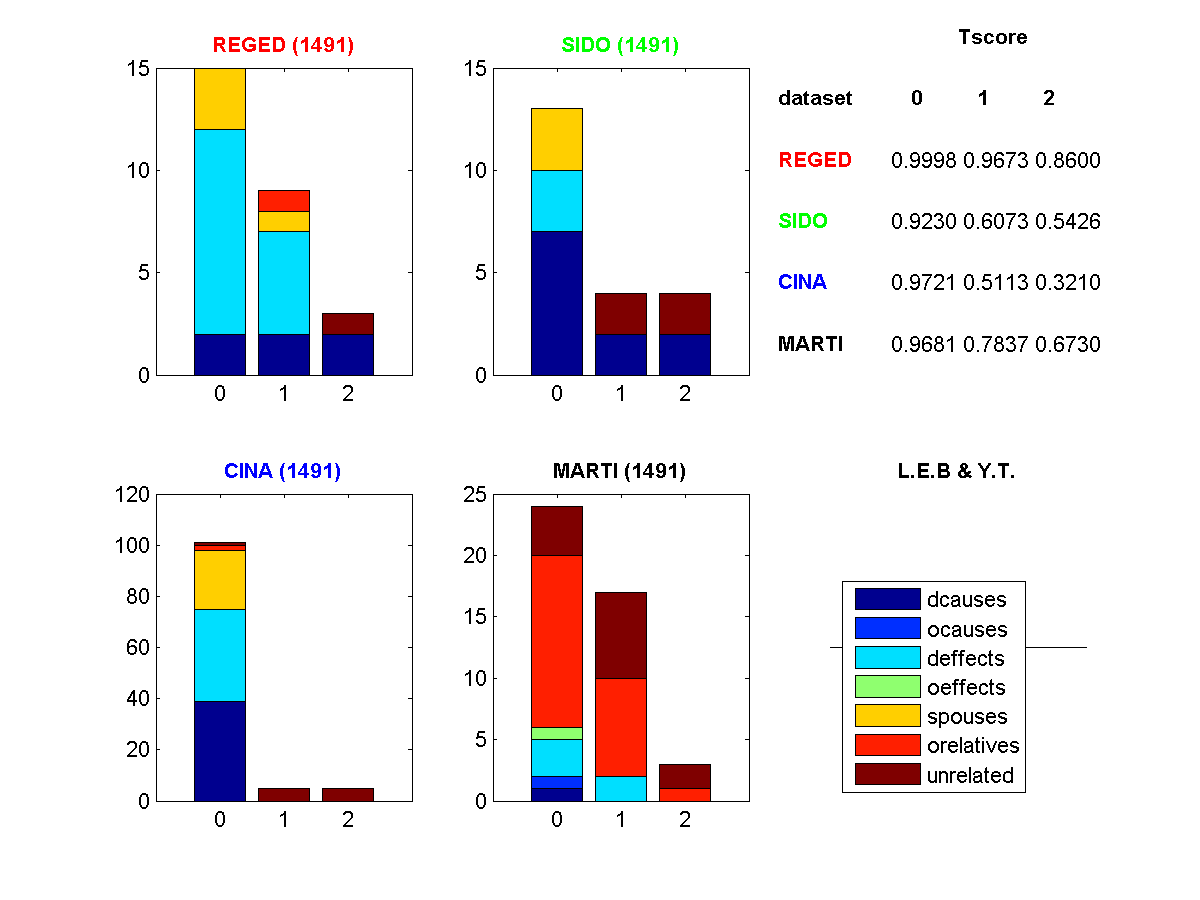
Figure 1: Profile of features selected. (Click to enlarge). Legend: dcause=direct cause, deffect=direct effects, ocauses=other causes (indirect), oeffects=other effects (indirect), spouses=parent of a direct effect, orelatives=other relatives, unrelated=completely irrelevant
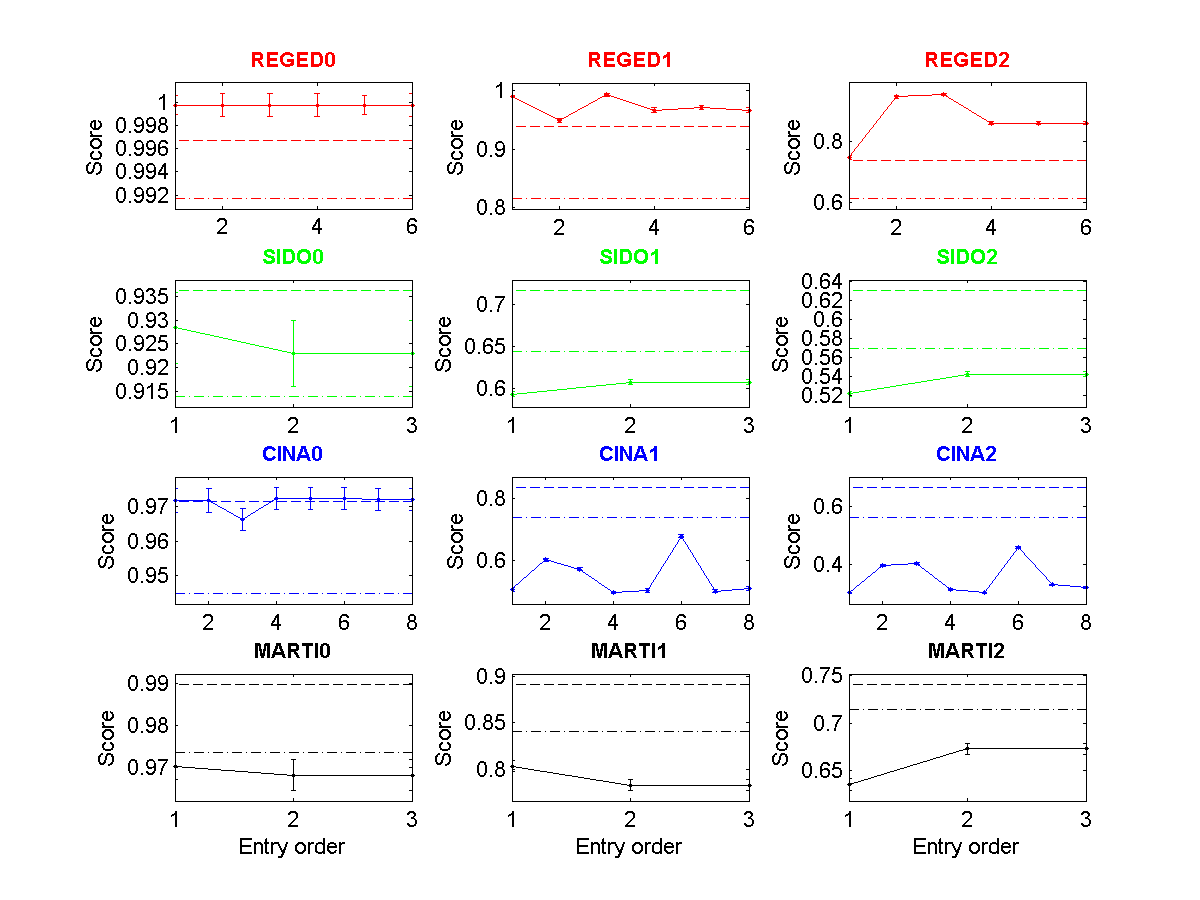
Figure 2: Tscore of all entries made as a function of entry order. (Click to enlarge). The dashed lines indicate the 25 and 50 percentiles.
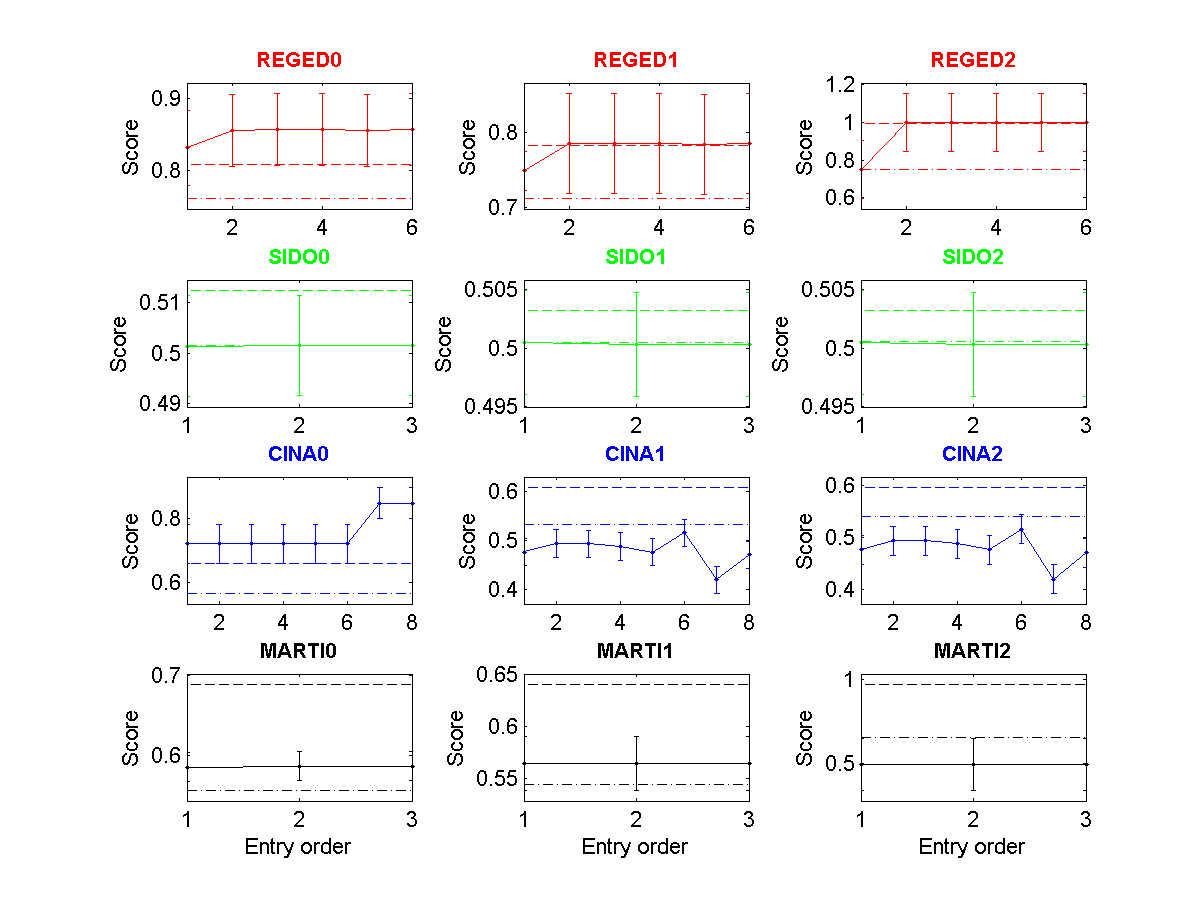
Figure 3: Fscore of all entries made as a function of entry order. (Click to enlarge). The dashed lines indicate the 25 and 50 percentiles.
| * | Entry | Method | Fnum | Fscore | Tscore (Ts) | Top Ts | Max Ts | <Tscore> | Rank |
| REGED0 | 1491 | final test | 15/999 * | 0.8571 | 0.9998Ý0.0010 | 1.0000 | 1.0000 | ||
| REGED1 | 1491 | final test | 9/999 * | 0.7851 | 0.9673Ý0.0036 | 0.9980 | 0.9980 | 0.9423 | |
| REGED2 | 1491 | final test | 3/999 * | 1.0000 | 0.8600Ý0.0053 | 0.8600 | 0.9534 | ||
| SIDO0 | 1491 | final test | 13/4932 * | 0.5015 | 0.9230Ý0.0069 | 0.9443 | 0.9467 | ||
| SIDO1 | 1491 | final test | 4/4932 * | 0.5003 | 0.6073Ý0.0027 | 0.7532 | 0.7893 | 0.6909 | |
| SIDO2 | 1491 | final test | 4/4932 * | 0.5003 | 0.5426Ý0.0027 | 0.6684 | 0.7674 | ||
| CINA0 | 1491 | final test | 101/132 * | 0.8496 | 0.9721Ý0.0031 | 0.9788 | 0.9788 | ||
| CINA1 | 1491 | final test | 5/132 * | 0.4716 | 0.5113Ý0.0053 | 0.8977 | 0.8977 | 0.6015 | |
| CINA2 | 1491 | final test | 5/132 * | 0.4716 | 0.3210Ý0.0025 | 0.8157 | 0.8910 | ||
| MARTI0 | 1491 | final test | 24/1024 * | 0.5869 | 0.9681Ý0.0037 | 0.9996 | 0.9996 | ||
| MARTI1 | 1491 | final test | 17/1024 * | 0.5643 | 0.7837Ý0.0056 | 0.9470 | 0.9542 | 0.8083 | |
| MARTI2 | 1491 | final test | 3/1024 * | 0.4985 | 0.6730Ý0.0060 | 0.7975 | 0.8273 |
