Report for M.B. |

Figure 1: Profile of features selected. (Click to enlarge). Legend: dcause=direct cause, deffect=direct effects, ocauses=other causes (indirect), oeffects=other effects (indirect), spouses=parent of a direct effect, orelatives=other relatives, unrelated=completely irrelevant
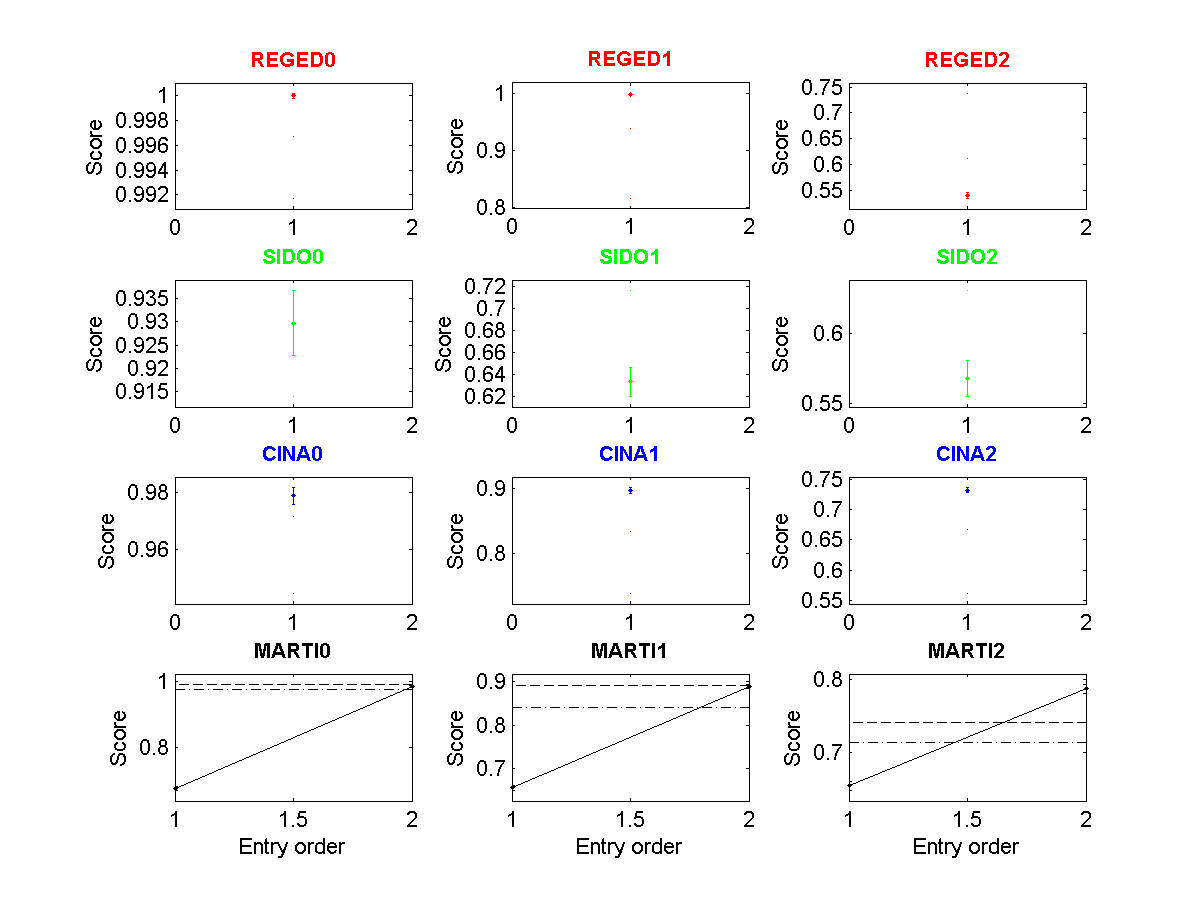
Figure 2: Tscore of all entries made as a function of entry order. (Click to enlarge). The dashed lines indicate the 25 and 50 percentiles.
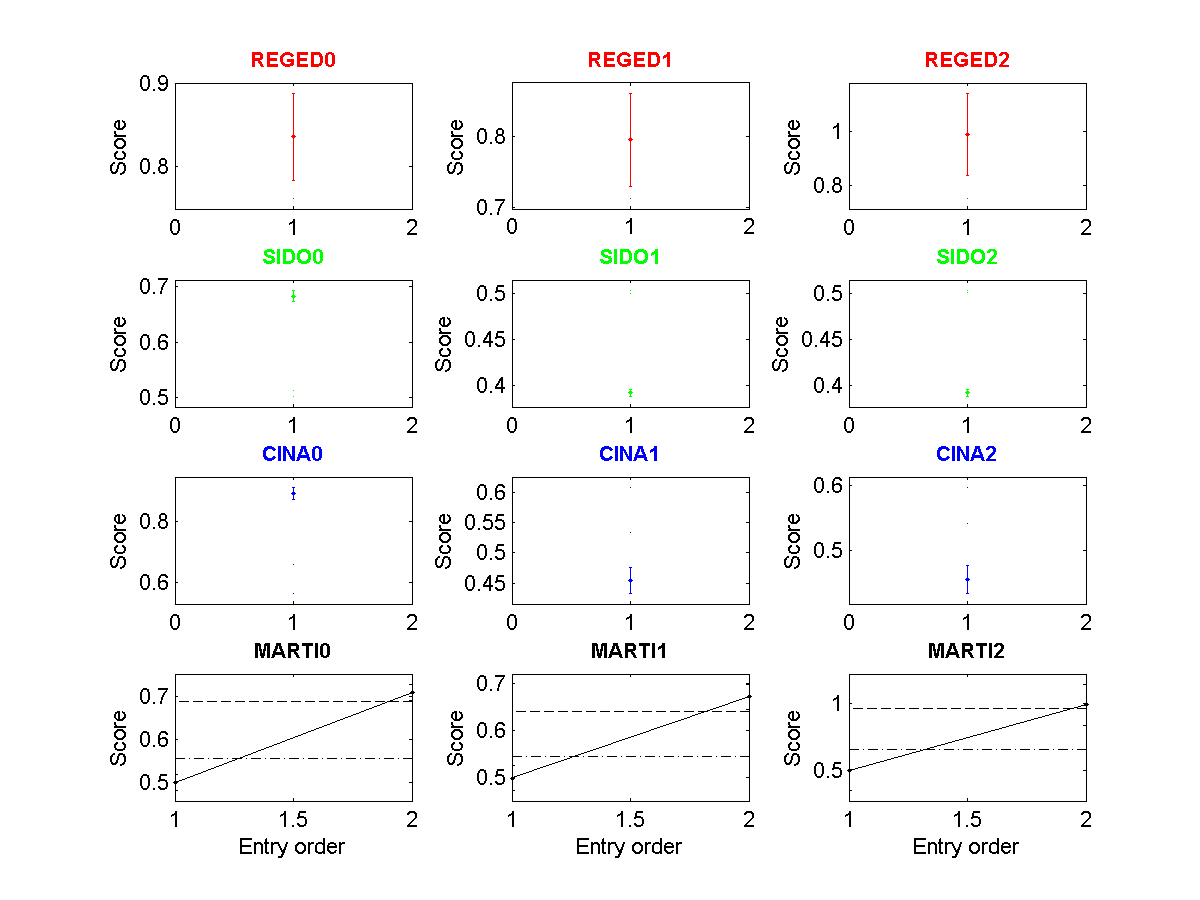
Figure 3: Fscore of all entries made as a function of entry order. (Click to enlarge). The dashed lines indicate the 25 and 50 percentiles.
| * | Entry | Method | Fnum | Fscore | Tscore (Ts) | Top Ts | Max Ts | <Tscore> | Rank |
| REGED0 | 321 | "SNB(CMA), IID assumption" | 122/999 * | 0.8352 | 1.0000Ý0.0002 | 1.0000 | 1.0000 | ||
| REGED1 | 321 | "SNB(CMA), IID assumption" | 122/999 * | 0.7946 | 0.9980Ý0.0015 | 0.9980 | 0.9980 | 0.8462 | |
| REGED2 | 321 | "SNB(CMA), IID assumption" | 122/999 * | 0.9910 | 0.5407Ý0.0061 | 0.8600 | 0.9534 | ||
| SIDO0 | 321 | "SNB(CMA), IID assumption" | 1592/4932 * | 0.6831 | 0.9297Ý0.0070 | 0.9443 | 0.9467 | ||
| SIDO1 | 321 | "SNB(CMA), IID assumption" | 1592/4932 * | 0.3922 | 0.6337Ý0.0132 | 0.7532 | 0.7893 | 0.7104 | |
| SIDO2 | 321 | "SNB(CMA), IID assumption" | 1592/4932 * | 0.3922 | 0.5678Ý0.0129 | 0.6684 | 0.7674 | ||
| CINA0 | 321 | "SNB(CMA), IID assumption" | 90/132 * | 0.8913 | 0.9788Ý0.0029 | 0.9788 | 0.9788 | ||
| CINA1 | 321 | "SNB(CMA), IID assumption" | 90/132 * | 0.4542 | 0.8977Ý0.0043 | 0.8977 | 0.8977 | 0.8694 | |
| CINA2 | 321 | "SNB(CMA), IID assumption" | 90/132 * | 0.4542 | 0.7318Ý0.0043 | 0.8157 | 0.8910 | ||
| MARTI0 | 386 | "SNB(CMA), IID assumption (F)" | 22/1024 * | 0.7097 | 0.9848Ý0.0031 | 0.9996 | 0.9996 | ||
| MARTI1 | 386 | "SNB(CMA), IID assumption (F)" | 22/1024 * | 0.6716 | 0.8891Ý0.0043 | 0.9470 | 0.9542 | 0.8869 | |
| MARTI2 | 386 | "SNB(CMA), IID assumption (F)" | 22/1024 * | 0.9936 | 0.7868Ý0.0058 | 0.7975 | 0.8273 |
